1. Introduction
Construction of a steam temperature exceeding 650 °C (super) supercritical power station puts forward more stringent requirements for heat-resistant materials used for its components [
1,
2]. Compared with austenitic heat-resistant steels and nickel-based alloys, martensitic heat-resistant steels represented by P91, P92, and G115 exhibit superior advantages, including lower alloy content, reduced thermal expansion coefficient, higher thermal conductivity, and cost-effectiveness. These merits enable extended service life under rapid thermal cycling conditions, making them preferred materials for critical components such as boiler superheaters, reheaters, and steam pipelines. However, standard heat-treated P92 steel demonstrates limited long-term service temperature stability (600–628 °C) due to high-temperature grain boundary softening, matrix solute depletion, and coarsening of secondary phases (M
23C
6, MX, Laves, and Z-phase) [
3,
4,
5], falling short of the 650–700 °C requirements for advanced (ultra)supercritical units.
Martensitic steels undergo creep deformation during prolonged service, with fracture mechanisms varying under different creep conditions [
6]. Xiao et al. [
7] revealed that G115 steel at 650 °C exhibited dislocation climb-dominated creep under low stress (150–170 MPa), where microvoids initiated at prior austenite grain boundaries (PAGBs) or martensite lath boundaries due to coarsened M
23C
6/Laves phases. Conversely, grain boundary sliding dominated under high stress (190–250 MPa), causing stress concentration-induced intergranular cracking. Yu et al. [
8] reported similar findings. Earlier studies by Lee et al. [
9] identified triple junctions of grain boundaries as preferential sites for creep cavity formation. Cheng et al. [
10,
11] further demonstrated that grain boundary softening-induced sliding primarily caused damage in 2.2Cr steel, while dynamic recrystallization along PAGBs during 650 °C tensile tests effectively retarded fracture by dispersing carbides. Based on the above research, it is evident that the grain boundaries, especially the softening of the PAGBs, are the weak link of fracture failure during the high-temperature tensile and creep process of martensite heat-resistant steels. Therefore, the regulation of PAGBs is of positive significance to further improve the high-temperature strength of martensitic heat-resistant steels.
Current strategies for grain boundary stabilization involve two approaches: Compositional optimization through microalloying (e.g., boron addition to refining M
23C
6 precipitation [
12,
13,
14], and thermomechanical processing to modify grain boundary characteristics and carbide distribution [
15,
16,
17]. Li et al. [
18] confirmed that thermomechanical processing refined the two primary precipitates in P92 steel, with average particle sizes of M
23C
6 and MX phases reduced to 50 nm and 5 nm, respectively, compared to 100 nm and 20 nm after standard heat treatment. Their research showed this microstructural refinement resulted in a 30% increase in yield strength and substantially improved creep resistance, with creep rupture life increasing by factors of 3.2 and 2.5 at 600 °C/210 MPa and 650 °C/160 MPa, respectively. Furthermore, studies on optimizing grain boundary characteristics through thermomechanical processing are very limited compared with the regulation of precipitation states [
19,
20,
21,
22,
23].
Investigating the effects of different thermomechanical treatments on the microstructure and high-temperature mechanical properties of martensitic heat-resistant steels is critical for advancing their performance, particularly by tailoring the distribution of PAGBs under the martensitic phase region. In this study, different post-rolling strategies under themartensitic phase region are compared based on a high-boron P92 steel. Post-treatment specimens are subjected to high-temperature mechanical testing, and the relationships between microstructure, precipitates, dislocation density, texture evolution, and mechanical performance are theoretically elucidated.
2. Experimental Process
The research material was a high-boron P92 martensitic heat-resistant steel ingot fabricated through melting and forging; its chemical composition is given in
.
.
Chemical compositions of P92 steel (wt.%).
| Element |
C |
Mn |
Si |
Cr |
Mo |
Nb |
V |
Ni |
B |
W |
N |
| Wt.% |
0.12 |
0.45 |
0.53 |
9 |
0.5 |
0.06 |
0.2 |
0.23 |
0.0086 |
1.94 |
0.05 |
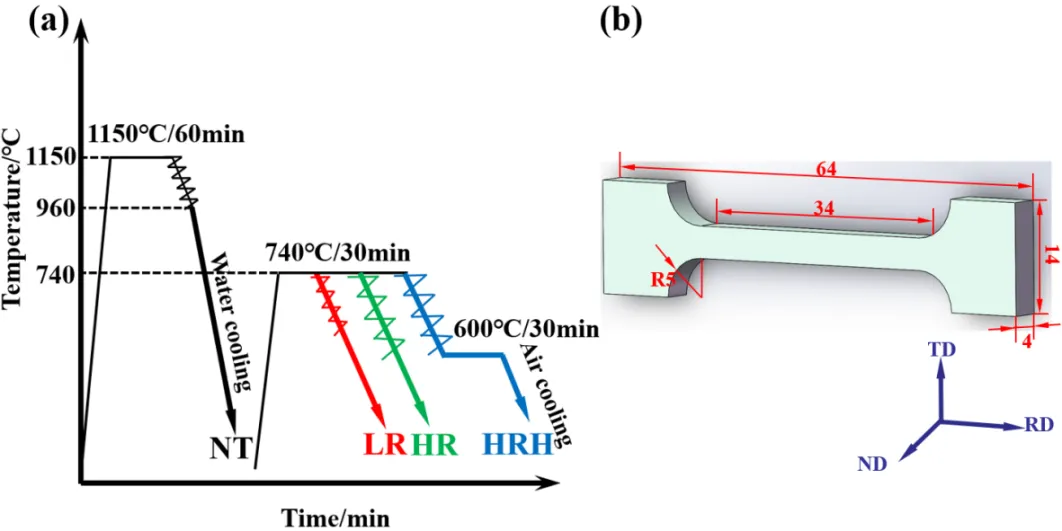
Two square cast blocks (70 mm × 70 mm × 35 mm) were wire-cut from the ingot and subsequently subjected to the thermomechanical treatment process shown in
a to obtain four plates. The processing route consisted of two main stages: First, both cast blocks were homogenized at 1150 °C for 60 min, followed by two-pass rolling within 1150–960 °C range and water quenching to produce 13 mm-thick hot-rolled plates. The two rolled plates were then cut along the near-length midline to obtain four approximately identical plates, with one randomly selected as NT (Normalization Treatment). The remaining three plates underwent different thermomechanical treatments: All were initially homogenized at 740 °C for 30 min. Subsequently, one plate was rolled to 8 mm thickness (LR, Low Reduction), another was rolled to 5 mm thickness (HR, High Reduction), while the last plate was first rolled to 5 mm thickness followed by 30 min holding at 600 °C (HRH, High Reduction and 600 °C Holding).
. Post rolling strategies are depicted in (<b>a</b>), and dimension of the tensile sample is showed in (<b>b</b>).
The microstructural evolution after thermo-mechanical processing was systematically characterized through multi-scale analytical techniques. Scanning electron microscopy (SEM) observations were performed using a Zeiss Ultra 55 system, while crystallographic orientation and localized texture analysis were conducted on a FEI Quanta FEG 450 thermal field emission SEM equipped with OIM EBSD system, operating at 20 kV acceleration voltage with step sizes of 0.1–0.12 μm. Detailed substructure characterization, including dislocation configurations, recrystallization behavior, and precipitation crystallography, was carried out using a Tecnai F20 field emission transmission electron microscope (TEM). Macrotexture analysis employed a Bruker D8 Advance X-ray diffractometer (XRD) with Cu Kα radiation to acquire {110}, {200}, and {211} pole figures. The measurements utilized θ-θ geometry with α-angle coverage of 0°–70° and β-angle rotation of 0°–360°, recorded at 5° intervals. Orientation distribution function (ODF) maps were subsequently calculated from the experimental pole figures using TexEval software. High-temperature tensile testing was performed on a custom-built AIST-20 in-situ tensile stage with argon shielding. Specimens with standardized dimensions (20 mm gauge length, 4 × 4 mm cross-section, as illustrated in
b) underwent controlled heating to target temperatures followed by 10 min thermal stabilization. Uniaxial deformation was applied at a constant crosshead speed of 1.2 mm/min. Post-deformation analysis combined fractographic examination via SEM with EBSD characterization of subsurface texture evolution near fracture surfaces.
3. Results
3.1. Microstructure Morphology
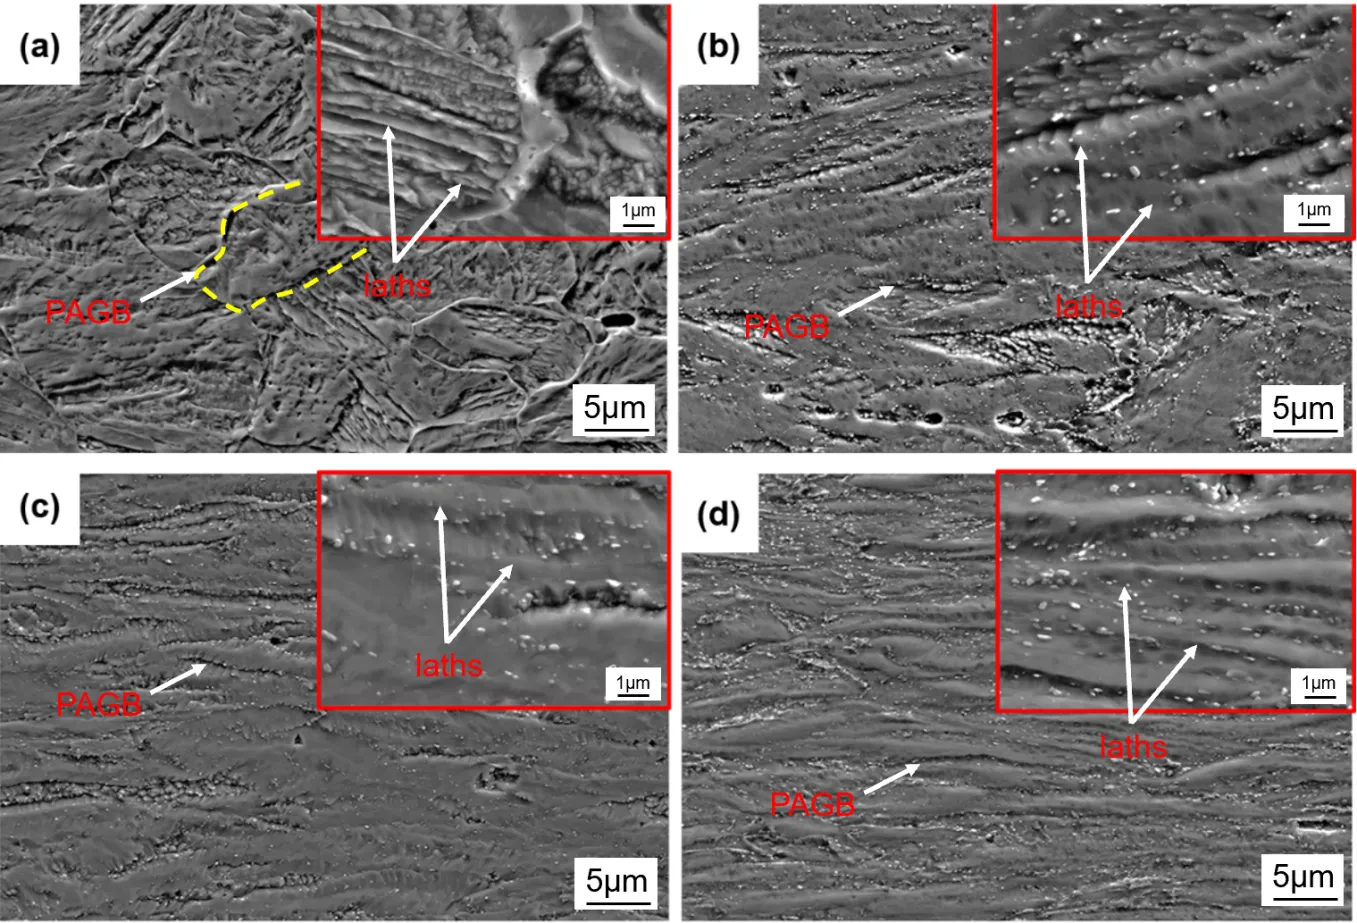
presents the microstructures of modified P92 martensitic heat-resistant steel after different thermomechanical treatments. The NT specimen exhibits an equiaxed lath martensite structure (
a), where distinct martensite lath packets, blocks, and uniformly oriented laths are clearly visible. However, due to the fast cooling rate restricting the diffusion of alloying elements during the quenching process, the precipitates were not formed within the grains [
24]. In the LR specimen (
b), although part of the PAGBs remain observable, both martensite lath packets and block boundaries show severe disruption. The number density of precipitate increases significantly compared to NT specimen, accompanied by coarsened martensite laths. The HR specimen subjected to higher deformation (
c) displays more elongated PAGBs along the rolling direction, with progressively blurred lath/block boundaries. The martensite laths become further refined, and precipitate density shows similar states with the LR specimen. Notably, the HRH specimen, after post-deformation annealing (
d), develops higher density precipitates on martensite laths, which not only increase in quantity but also become finer compared to the HR specimen, predominantly distributing within the elongated grain boundaries.
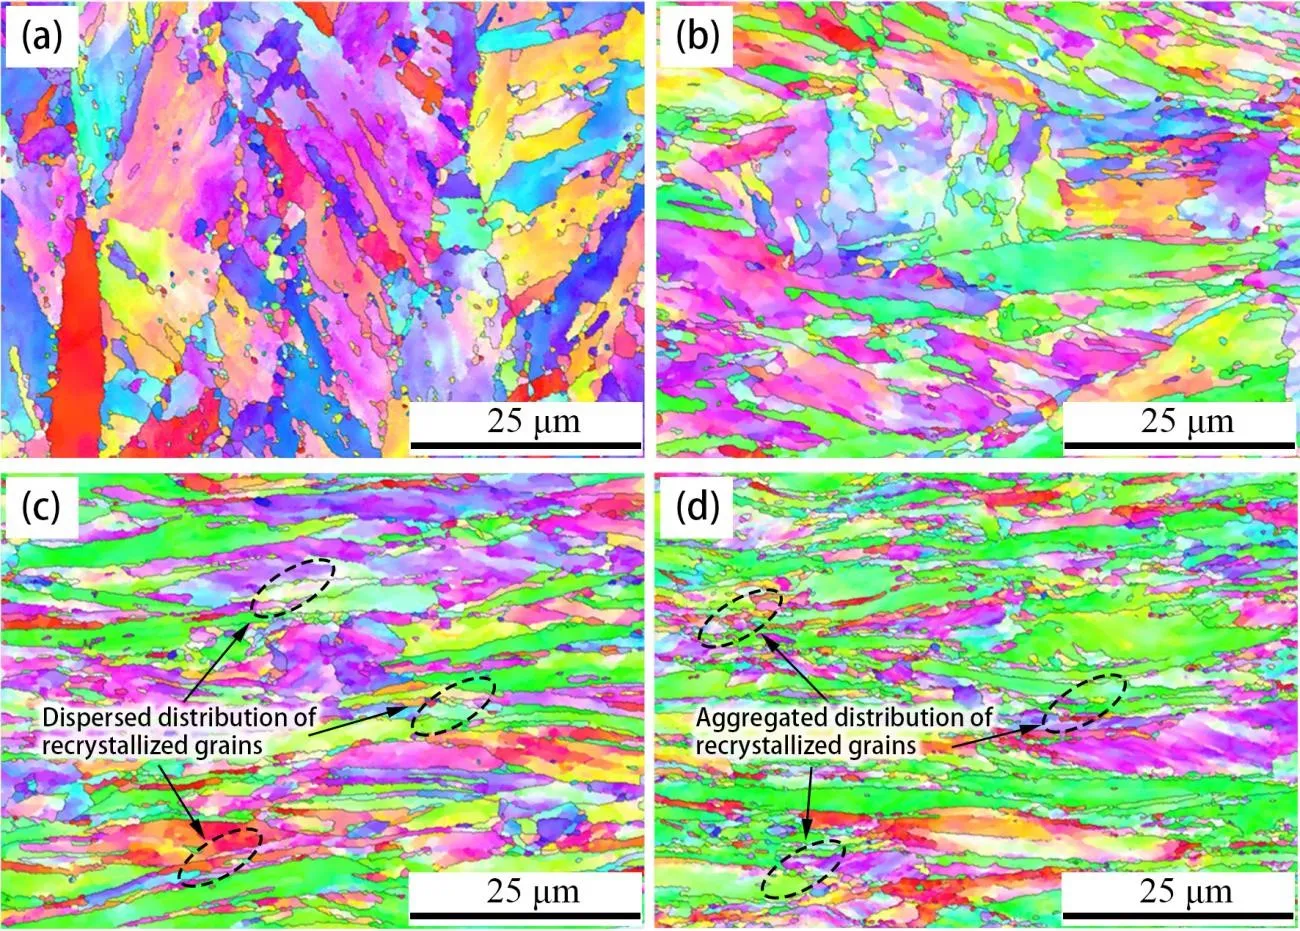
shows the IPF maps of modified P92 steel specimens subjected to different rolling processes. The red, green, and blue colors represent grains with <001>//ND, <101>//ND, and <111>//ND orientations, respectively.
a shows that in the NT sample, the grains show randomly dispersed martensitic laths.
b reveals that in the LR sample, the grains turn to be elongated along the rolling direction (horizontal), with serrated protrusions at prior austenite grain boundaries and a small number of dispersed recrystallized grains along these boundaries [
25].
c demonstrates that the HR sample with increased deformation exhibits more severe substructural deformation in the lath martensite matrix, accompanied by an increased quantity of recrystallized grains along grain boundaries. In
d, the HRH sample subjected to post-rolling isothermal treatment shows partial recrystallization of distorted grains.
summarizes the statistical results of recrystallized, partially recrystallized, and deformed grain fractions in the four specimens. Recrystallized grains were identified by their equiaxed morphology with high-angle grain boundaries (>15°) and low internal misorientation (<1°), while partially recrystallized grains exhibited transitional features with localized recrystallized areas embedded in a deformed matrix. The NT sample contains the highest proportion of partially recrystallized grains (64.7%), while the HRH sample shows maximum values for both recrystallized (6.7%) and deformed grains (53.2%). This phenomenon is attributed to enhanced recrystallization driving force under heavy deformation and subsequent isothermal treatment, which promote the multiplication and rearrangement of dislocations and finally facilitate the transition of subgrains to recrystallized grains.
. SEM microstructure of the four samples are presented in (<b>a</b>) NT, (<b>b</b>) LR, (<b>c</b>) HR, (<b>d</b>) HRH.
.
Statistics on the proportion of recrystallized grains, partially recrystallized grains and deformed grains in each sample.
| Grain Type |
F(NT)/% |
F(LR)/% |
F(HR)/% |
F(HRH)/% |
| Recrystallized grains |
2.9% |
5.4% |
6.4% |
6.7% |
| Partially recrystallized grains |
64.7% |
43.5% |
41.9% |
40.1% |
| Deformed grains |
32.3% |
51.1% |
51.7% |
53.2% |
. IPF maps of the four samples that acquired through EBSD are depicted in (<b>a</b>) NT, (<b>b</b>) LR, (<b>c</b>) HR, (<b>d</b>) HRH.
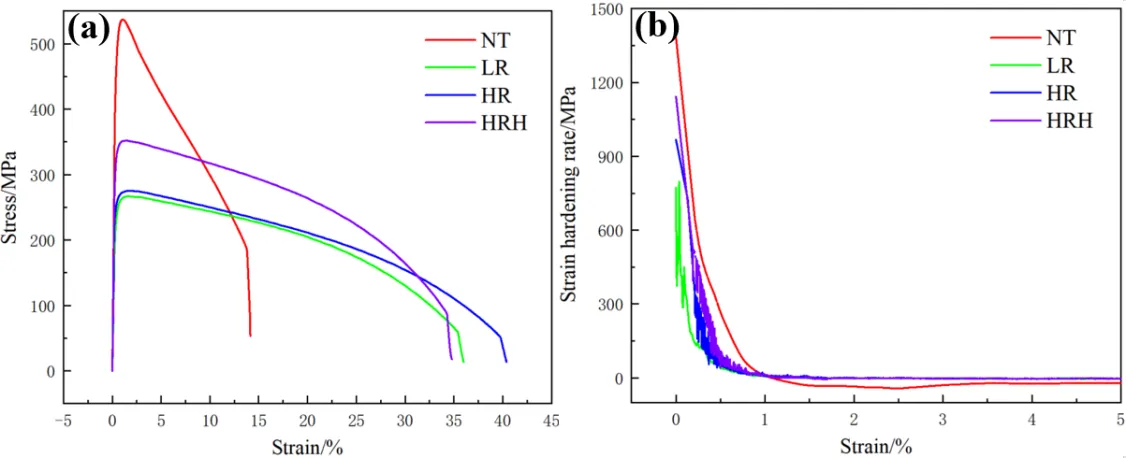
presents the high-temperature tensile stress-strain curves (
a) and strain hardening rate-strain curves (
b) of the four specimens at 700 °C. There is no obvious yield point in the tensile curves, and significant softening is detected after reaching the tensile strength. The softening of the material is mainly caused by the rearrangement and annihilation of dislocations, which can be affected by the activation of slipping systems and also the texture states of the ferritic matrix. The evolution of dislocations during the softening process ultimately leads to the recrystallization of the deformed matrix.
In
a, the stress-strain curves of sample LR and HR exhibit near-overlapping profiles with minimal differences in mechanical properties, while sample HRH demonstrates significantly enhanced tensile strength. As summarized in
, Sample HRH achieves tensile strength increments of 85 MPa and 77 MPa compared to samples LR and HR, respectively, along with elastic modulus improvements of 39.4 GPa and 17.6 GPa. However, these strength enhancements only lead to a small expense of ductility. Sample NT exhibits the highest yield strength (526 MPa) and tensile strength (537 MPa), substantially exceeding those of Sample LR (325 MPa and 352 MPa). Nevertheless, its limited elongation (13.8%) indicates that this ultrahigh strength is achieved through severe ductility compromise, rendering it unsuitable as a base material for ultra-supercritical unit steam pipelines [
26]. While Sample LR demonstrates superior elongation (38.8%) and reduction of area (92.3%) at 700 °C, its strength degradation relative to Sample NT remains excessive (283 MPa). The comparative analysis identifies Sample HRH as the optimal candidate, balancing enhanced strength parameters with acceptable ductility levels.
.
High-temperature mechanical properties of the four samples.
| Sample |
Tensile Strength Rm/MPa |
Yield Strength R0.2/MPa |
Elastic Modulus E/GPa |
Elongation δ/% |
Reduction of Area ψ/% |
| NT-700 °C |
537 (7.4) |
526 (10.1) |
139.8 (10.5) |
13.8 (1.2) |
75.6 (7.1) |
| LR-700 °C |
267 (3.2) |
243 (3.8) |
74.8 (12.4) |
38.8 (3.2) |
92.3 (3.8) |
| HR-700 °C |
275 (2.7) |
272 (4.2) |
96.6 (3.6) |
35.4 (2.7) |
91.5 (6.3) |
| HRH-700 °C |
352 (2.1) |
325 (5.1) |
114.2 (5.2) |
33.6 (1.8) |
89.7 (1.2) |
. High-temperature tensile mechanical properties of the four samples (<b>a</b>) Stress-strain curves at 700 °C (<b>b</b>) Strain hardening rate curves at 700 °C.
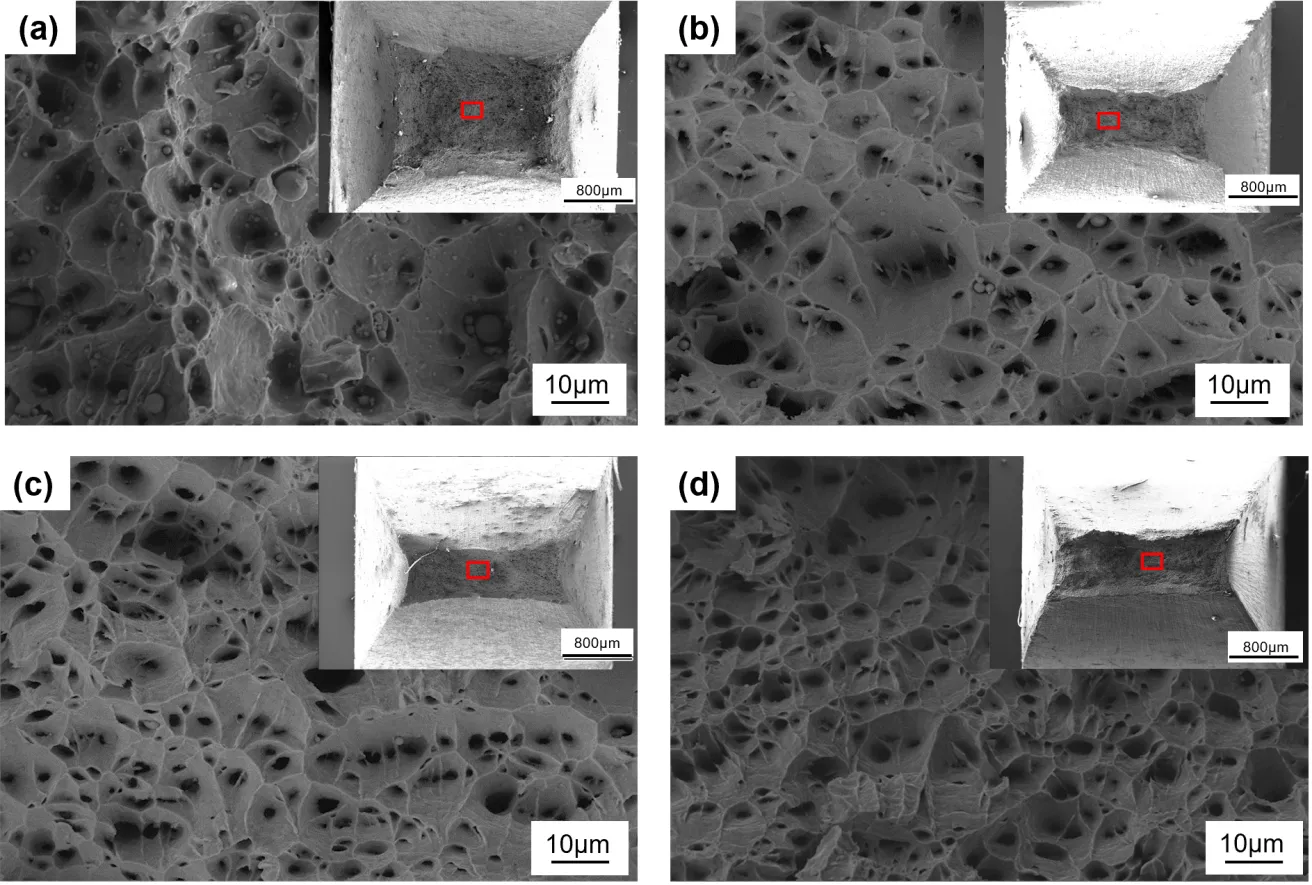
displays the fracture morphologies of specimens subjected to tensile test at 700 °C. Macroscopically, all fracture surfaces exhibit a morphology with elevated peripheries and depressed central regions, showing no apparent oxidation due to the protection of argon. Notably, specimen NT differs significantly from others, displaying the smallest aspect ratio and the largest fracture area. Additionally, plastic dimples formed under triaxial stress are observed. These dimples arise from dislocation loop accumulation around precipitates and subsequent interfacial separation between precipitates and the metal matrix [
27]. All specimens exhibit typical ductile fracture characteristics, with numerous dimples and plastic pores distributed across the fracture surfaces. As shown in
b, Specimen LR features large, deep dimples indicative of superior plasticity. In contrast, Specimen NT (
a) demonstrates shallower dimples with coarser precipitates, correlating with its inferior plasticity observed in prior mechanical property evaluations.
presents EBSD grain orientation and Image Quality (IQ) maps of near-fracture microstructures for specimens NT and HRH.
a,b reveal that grains in both specimens are markedly elongated along the tensile direction. Specimen NT exhibits a larger grain size and is accompanied by nearly circular cavities. In contrast, Specimen HRH displays finer grains with evident recrystallized grain clusters. Sliding-induced grain boundary distortions alter both Kikuchi pattern bandwidth and clarity, making IQ maps effective for qualitative analysis of localized stress distribution. Thus, the red region indicates the lattice structure is perfect, and the dark green region represents high-density dislocations and substructures.
d shows higher maximum IQ values, which indicates that recrystallization can effectively avoid stress concentration during the tensile process.
. Tensile fracture morphologies of the four samples (<b>a</b>) NT, (<b>b</b>) LR, (<b>c</b>) HR, (<b>d</b>) HRH. The marked red rectangles indicates where the enlarged dimples are characterized.
. Grain orientation map and IQ map of NT and HRH samples after tensile test at 700 °C (<b>a</b>) NT grain orientation map, (<b>b</b>) HRH grain orientation map, (<b>c</b>) NT IQ map, (<b>d</b>) HRH IQ map.
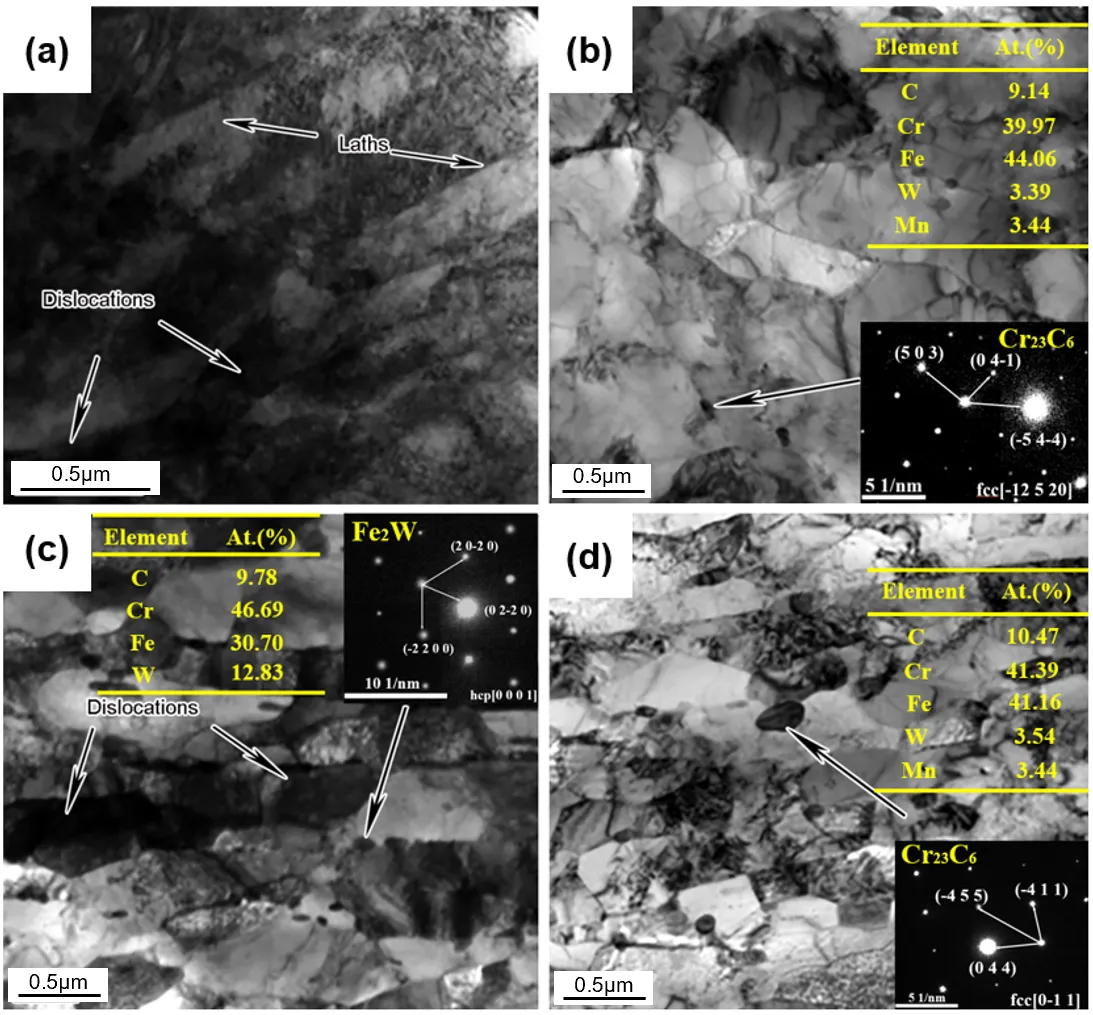
To further analyze the substructural features, recrystallization behavior, and precipitation states in the four specimens, TEM characterization and SAED (Selected Area Electron Diffraction) analysis were conducted, with the results presented in
. In
a, lath martensite and high-density dislocations are observed. For the LR sample shown in
b, the dislocation density decreases, and substructures such as martensite packets/blocks are hard to be distinguished. A small number of precipitates are dispersed along PAGBs, identified by SAED as Cr
23C
6 precipitates. As illustrated in
c, the HR sample subjected to heavy deformation exhibits elongated grains and grain boundaries, with high-density dislocations within the grains and numerous recrystallized grains are distributed along PAGBs. Additionally, close to the distorted grain boundaries, hexagonal close-packed (HCP) Fe
2W phases precipitate. Previous studies indicate that Laves phases (e.g., Fe
2W) typically form during the initial stages of high-temperature aging or creep process and coarsen over time [
28,
29,
30]. In the HRH sample (
d), during the isothermal holding process, the elongated martensitic structure undergoes recrystallization. This recrystallization process reduces the internal stress and dislocation density within the structure. Concurrently, the stored energy from the previous deformation contributes to a significant increase in the fraction of recrystallized grains.
. TEM map of samples after post rolling are present in (<b>a</b>) NT, (<b>b</b>) LR, (<b>c</b>) HR, (<b>d</b>) HRH, diffraction patterns and compositions of typical precipitates are inserted in corresponding maps.
4. Discussion
4.1. Relationship between Dislocation Density and Mechanical Properties
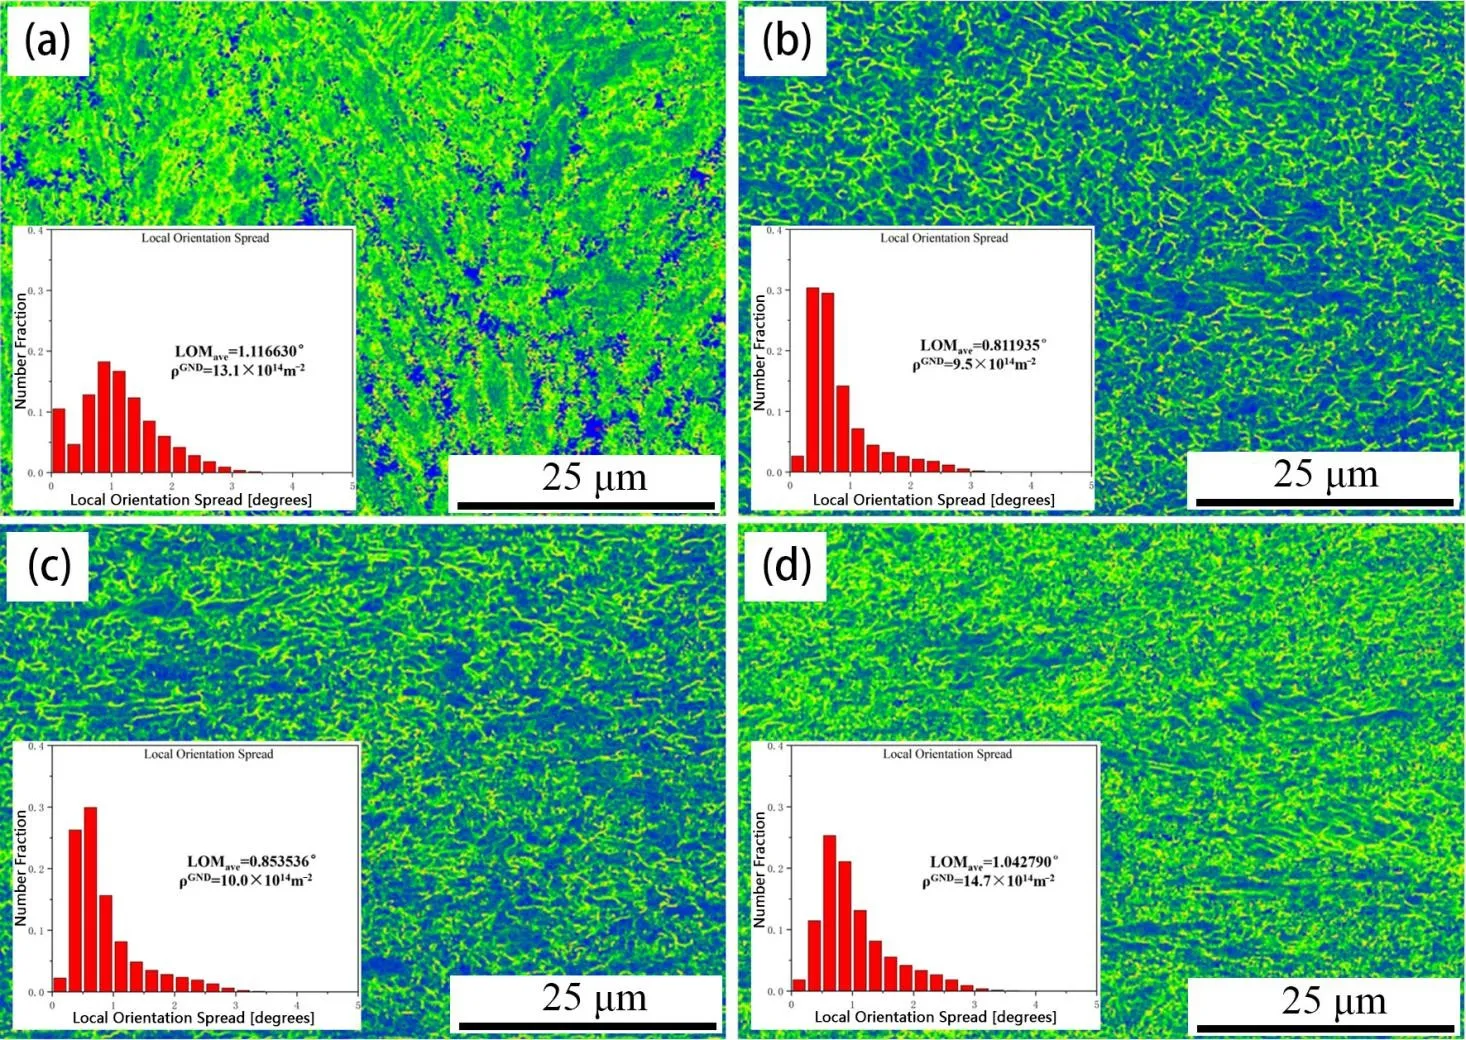
is KAM map of the four samples and it is obvious that the distribution of local orientation difference in the matrix is mainly concentrated within 3°, and the number density in the range of 0°–3° follows the change law of first increasing and then decreasing. H. Gao and L.P. Kubin et al. [
31,
32] propose a strain gradient model that can be used to calculate the density of geometrically necessary dislocations quantitatively:
In
Equation (1),
ρGND is the geometrically necessary dislocation (GND) density;
LOMave is the difference in the average local orientation; μ is the step size of EBSD scanning process; b is the burgers vector, and the average
LOMave values of samples after thermomechanical treatment are 1.116630°, 0.811935°, 0.853536° and 1.042790°, respectively. Among them, the average
LOMave value of HRH is higher than that of others. The lattice constant of the martensite bcc structure a = 0.2863 nm, and its stable burger vector is <111>/2. It can be seen that |b| = a/2*<111> = 0.2479 nm. The parameters can be calculated in the
Equation (2) to obtain the GND densities of NT, LR, HR, and HRH to be 13.1 × 10
14 m
−2, 9.5 × 10
14 m
−2, 10.0 × 10
14 m
−2 and 14.7 × 10
14 m
−2, respectively, of which the GND density of HRH is the largest because on the one hand, high boron P92 steel recovers after HRH treatment. The heterogeneous dislocations are offset by sliding or climbing, resulting in a decrease in dislocation density. On the other hand, the number density of precipitation increases significantly, and its ability to restrain the motion of dislocation is enhanced so that the probability of mutual attraction and annihilation of heterogeneous dislocations is reduced, which plays a more critical role during the tensile process. Moreover, the coarsening of the M
23C
6 can emit numerous GND along the precipitate-matrix interfaces, which is attributed to the transformation of the coherent interface of nanoscale precipitates into the incoherent interface of the coarsened precipitates. Therefore, the higher density of GND in the HRH specimen contributes to a significant increase in strength at 700 °C.
. KAM map of the four samples acquired through EBSD are depicted in (<b>a</b>) NT, (<b>b</b>) LR, (<b>c</b>) HR, (<b>d</b>) HRH. Distribution of local orientation spread and the calculated GND density are inserted correspondingly.
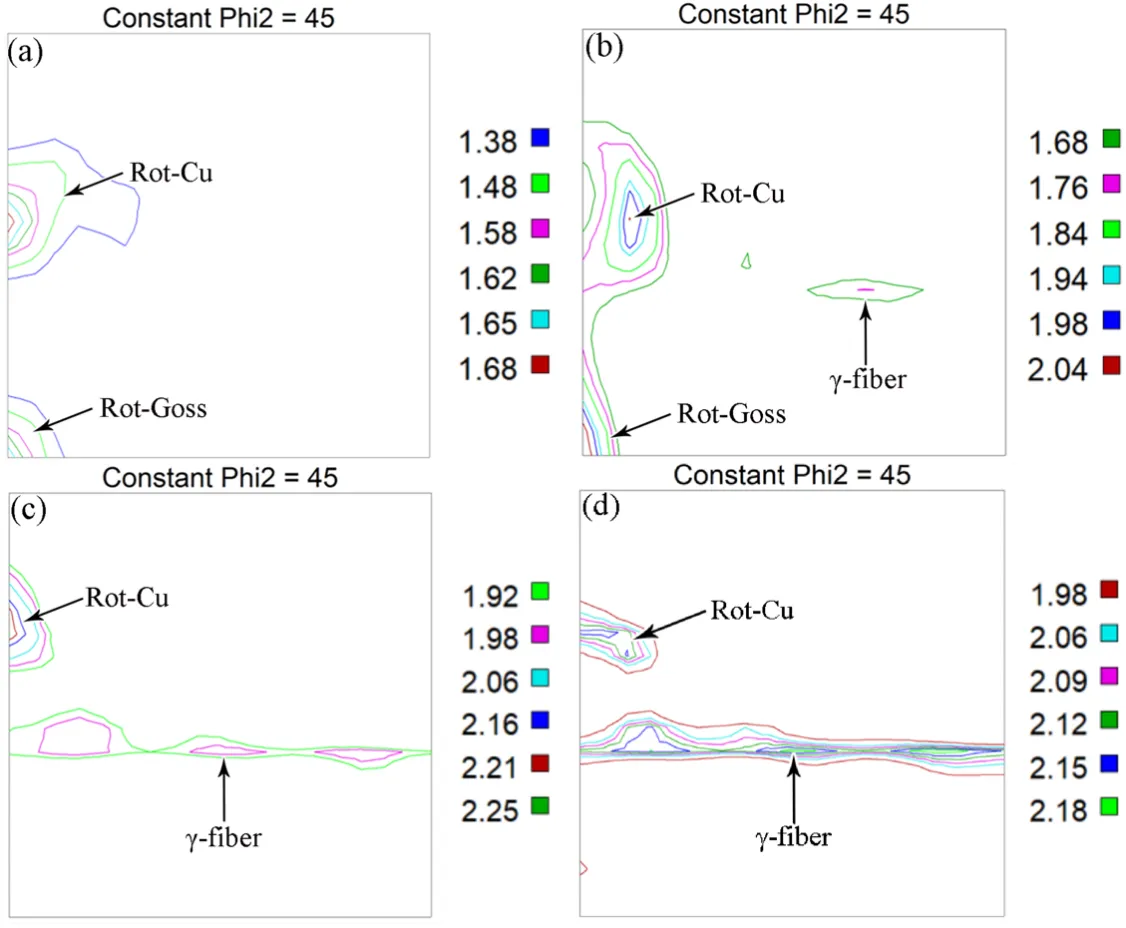
P92 martensitic steel has a body-centered cubic crystal structure, and its primary texture orientations are located on the φ2 = 45° constant section of the ODF map [
33]. The φ2 = 45° ODF maps of the specimens are shown in
. In
a (NT), the dominant texture is {112}<1–10> rotated Copper type with an intensity of 1.71, accompanied by a weaker {110}<1–10> rotated Goss texture. In
b (LR), the rotated Copper texture component changes to {112}<1–31> with an increased intensity of 2.04, while the rotated Goss texture {110}<1–10> remains and strengthens to 2.06. Additionally, a typical recrystallized γ texture {111}<0–11> appears with an intensity of 1.76.
In
c (HR), the rotated Copper texture component reverts to the same {112}<1–10> as in Sample NT, but its intensity significantly increases to 2.25. Concurrently, the rotated Goss texture disappears, and the recrystallized γ texture components increase. New texture types, including {111}<2–31>, {111}//ND, and {111}<1–32>, emerge with an overall high texture intensity of approximately 2.02, indicating that the rotated Copper texture still dominates. In
d (HRH), the intensity of the rotated Copper texture slightly decreases to 2.16 compared to Sample HR. In contrast, the recrystallized γ textures {111}<1–32>, {111}//ND, and {111}<1–32> exhibit slightly higher intensities of 2.18. Furthermore, a small amount of a new recrystallized texture {331}<1–10> appears with an intensity of 2.0, demonstrating that the recrystallized γ textures have replaced the rotated Copper texture as the dominant components.
. φ2 = 45° ODF map of the four samples are depicted in (<b>a</b>) NT, (<b>b</b>) LR, (<b>c</b>) HR, (<b>d</b>) HRH.
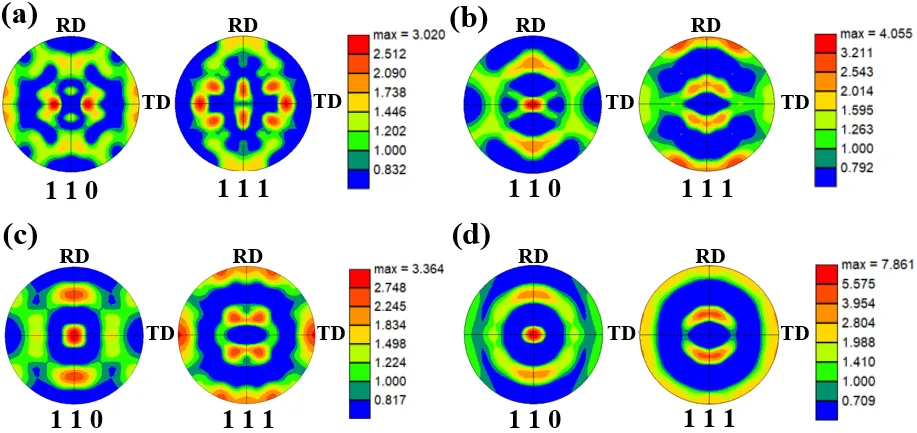
presents the micro-texture pole figures of Samples NT and HRH before and after high-temperature tensile testing at 700 °C. As shown in
a,b, the maximum pole densities of both NT and HRH after thermo-mechanical treatment are located on the {110} crystal plane. Specifically, Sample NT exhibits a bimodal <110>//TD texture with a peak intensity of 3.02, while Sample HRH displays a <110>//ND texture with a higher peak intensity of 4.06. Furthermore, minor texture components, including <110>//RD, <111>//RD, and <111>//TD, are observed in both samples.
. Micro-area texture polar figures near fracture of NT and HRH before and after tensile test are showed in (<b>a</b>) NT-before (<b>b</b>) HRH-before (<b>c</b>) NT-after (<b>d</b>) HRH-after.
After high-temperature tensile testing at 700 °C, the maximum pole densities on the {110} plane increase significantly to 3.36 (NT) and 7.86 (HRH), with both samples transitioning to a unified <110>//ND texture. This evolution is attributed to the preferential rotation of crystal planes toward the most stable <110> orientation during tensile deformation [
34,
35,
36]. Typical texture components within the microstructures and their evolution process can influence the mechanical properties, which is mainly related to the activation of slip systems during the tensile deformation process and is discussed in the following section.
4.3. Microscopic Slip Mechanism of Typical Texture Components
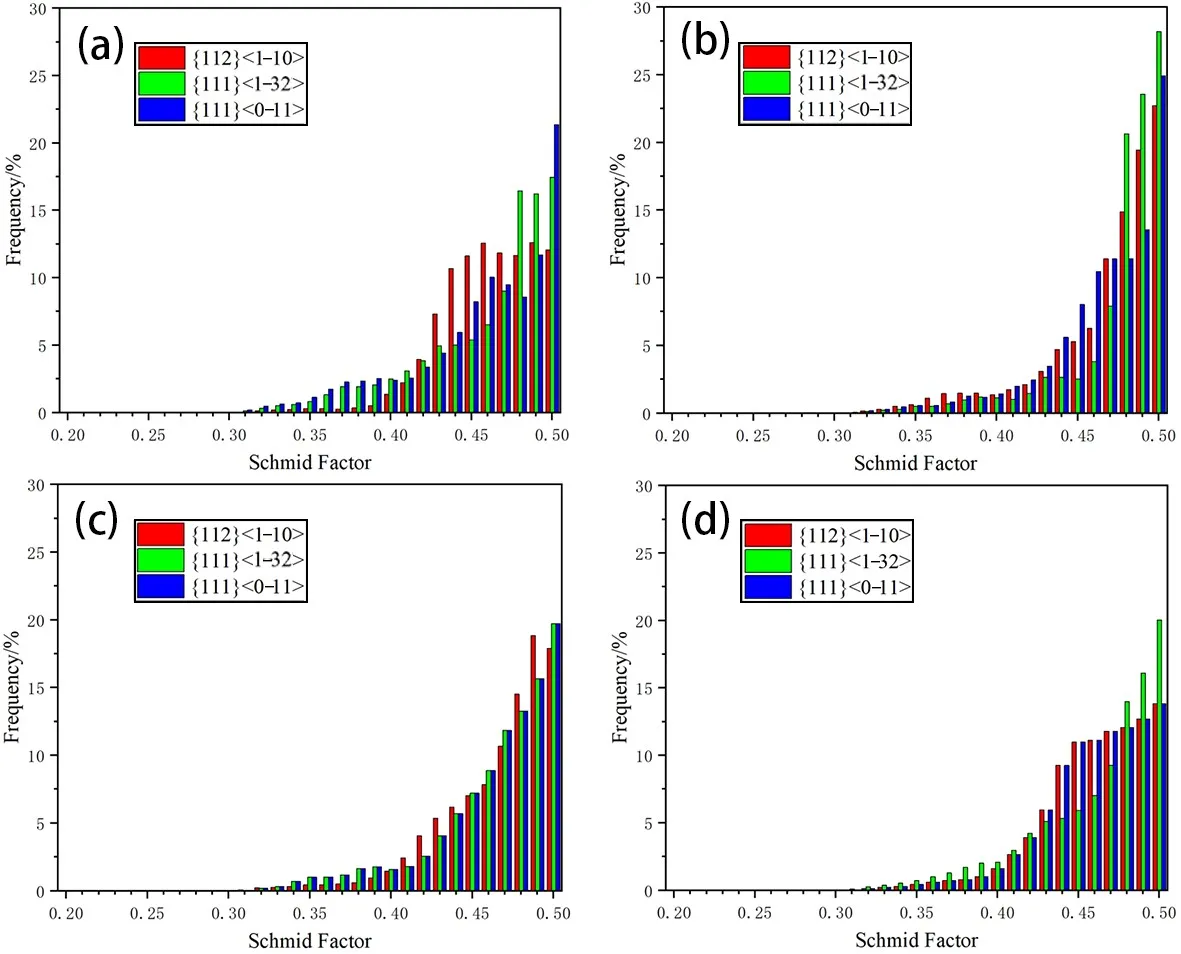
During plastic deformation, texture evolution primarily depends on the activation of slip systems before the necking process, while during the necking the, recrystallization turns out to be the dominant factor. The Schmid factor maps obtained through EBSD can theoretically explain the activation tendency of slip systems and the texture evolution process. According to the Schmid factor formula m = cosφ·cosλ (where φ is the angle between the force axis and the slip plane normal, and λ is the angle between the force axis and the slip direction), a larger Schmid factor indicates that the slip system is more easily activated, and plastic deformation occurs earlier.
shows the Schmid factor maps of the main slip systems in the thermo-mechanically treated samples. It can be observed that the Schmid factor values of {112}<1–10>, {111}<1–32>, and {111}<0–11> in all samples are distributed in the range of 0.3–0.5, and they generally follow the trend that the frequency increases with higher Schmid factor values. From
, Sample LR has the highest average Schmid factor values for its main slip systems, indicating that all slip systems are most easily activated, plastic deformation starts earliest, and plasticity is optimal. Samples NT and HRH have smaller and similar average Schmid factor values for their main slip systems. In the {112}<1–10> slip system, the average Schmid factor of Sample NT is slightly higher than that of Sample HRH, while in the {111}<1–32> and {111}<0–11> slip systems, the average Schmid factor of Sample HRH is slightly higher.
. Distribution of Schmid factors of main slip systems in the four samples (<b>a</b>) NT, (<b>b</b>) LR, (<b>c</b>) HR, (<b>d</b>) HRH.
.
Schmid factors of main slip systems in the four samples.
| Slip System |
NT |
LR |
HR |
HRH |
| {112}<1–10> |
0.455 |
0.461 |
0.459 |
0.453 |
| {111}<1–32> |
0.457 |
0.472 |
0.467 |
0.459 |
| {111}<0–11> |
0.445 |
0.457 |
0.453 |
0.446 |
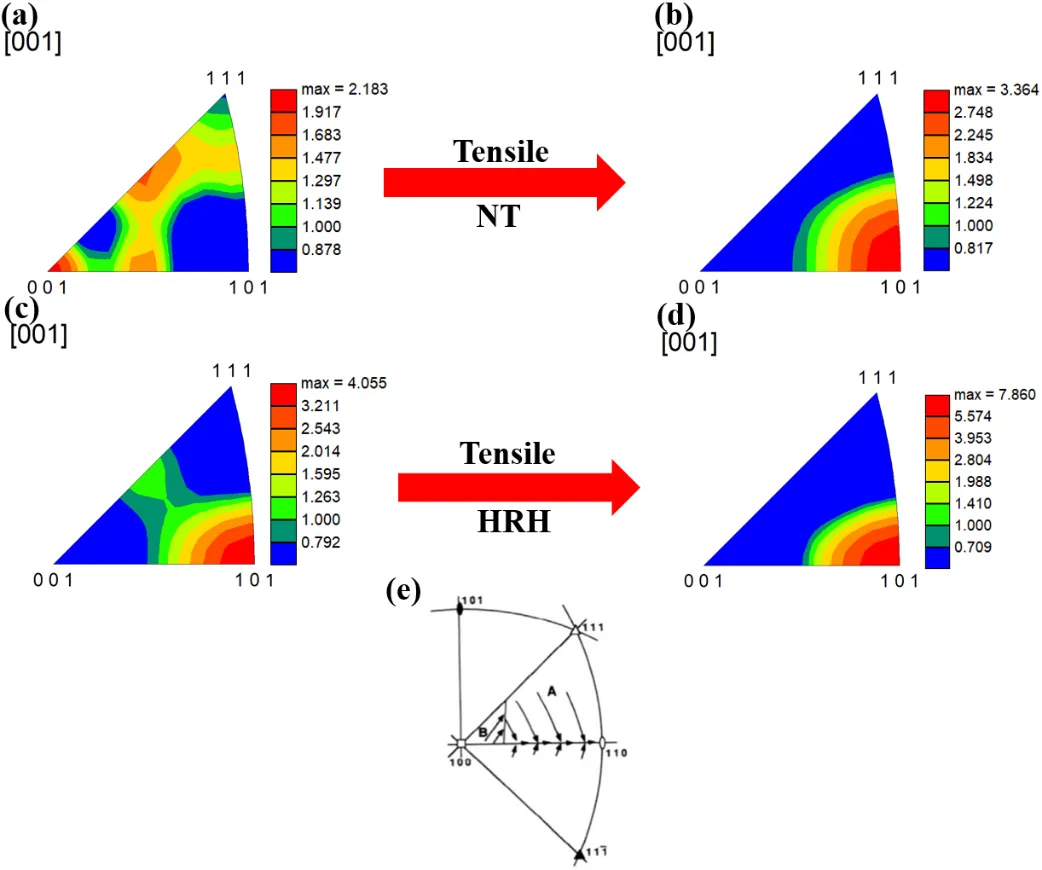
shows the inverse pole figures (IPFs) along the ND direction for Samples NT and HRH before and after tensile deformation. Combined with the pole figures in
, it can be seen that the peak pole density of Sample NT corresponds to a bimodal <110>//TD texture. Analysis of the inverse pole figures identifies it as the {101}<012> texture, which does not appear in the ND inverse pole figure shown in
a. The peak pole density in the ND direction is 2.18 for the <001>//ND texture, with a weaker <112>//ND texture also present. After tensile deformation, the grains in Sample NT rotate, causing crystal planes to align toward the <110> direction, resulting in a single strong <101>//ND texture with an intensity of 3.36, a 54.1% increase compared to before deformation. In contrast, Sample HRH already exhibits a <101>//ND texture with a peak intensity of 4.06 before deformation. After tensile deformation, the intensity of the <101>//ND texture further increases to 7.86, a 93.6% increase. Additionally,
shows that the texture intensity of Sample NT significantly increases after deformation, while the intensity of Sample HRH decreases, and anisotropy weakens, which is beneficial for further deformation and ultimately contributes to the best mechanical performance of HRH specimen.
. Inverse polar figure show the evolution of main texture intensity in ND direction of sample NT and HRH (<b>a</b>) NT-before, (<b>b</b>) NT-after, (<b>c</b>) HRH-before, (<b>d</b>) HRH-after, (<b>e</b>) Typical evolution of textures in BCC structure during tension.
.
Evolution of main texture intensity before and after the high-temperature tensile test.
| Slip System |
NT-before Tensile |
NT-after Tensile |
HRH-before Tenslie |
HRH-after Tensile |
| {112}<1–10> |
0.64 |
0.81 |
1.35 |
1.07 |
| {111}<1–32> |
0.84 |
2.23 |
4.80 |
4.24 |
| {111}<0–11> |
0.17 |
0.95 |
1.18 |
1.05 |
5. Conclusions
- (1)
-
Sample HRH subjected to post isothermal treatment exhibits a higher proportion of refined recrystallized grains, dispersed precipitates, and stronger recrystallized γ textures. Additionally, primary slip systems in the HRH sample exhibit smaller average Schmid factors during the tensile process, which makes the plastic deformation more difficult to activate as compared with the LR and HR samples, ultimately contributing to a higher strength.
- (2)
-
Mechanical properties of the LR and HR samples illustrate that an increase in rolling reduction shows a small impact on strength. However, the post isothermal treatment can significantly enhance the high-temperature strength and keep a favorable elongation for the HRH sample with UTS 352 MPa and EL 33.6 % at 700 °C.
- (3)
-
Post isothermal treatment not only promotes the transition of substructures to high-angle boundaries, but it also facilitates the nucleation and growth of precipitates, particularly for the M23C6 carbides. The increased number density of precipitates restrains the motion of dislocation and finally contributes the highest density of GND 14.7 × 10¹⁴ m−2 for the HRH sample.
Author Contributions
Conceptualization, L.C. and W.Y.; Methodology, F.F. and Q.G.; Software, C.C.; Validation, W.Y., and L.C.; Formal Analysis, L.C.; Investigation, F.F.; Resources, L.C.; Data Curation, F.F.; Writing—Original Draft Preparation, F.F. and Q.G.; Writing—Review & Editing, F.F. and L.C.; Visualization, C.C.; Supervision, L.C.; Project Administration, W.Y.; Funding Acquisition, L.C.
Ethics Statement
Not applicable.
Informed Consent Statement
Not applicable.
Data Availability Statement
The data that support the findings of this study are available from the corresponding author upon reasonable request.
Funding
This research was funded by [The National Natural Science Foundation of China] grant number [52201059], [The Postdoctoral Research Foundation of China] grant number [2019TQ0028], and [The Fundamental Research Funds for the Central Universities] grant number [FRF-TP-19-010A1].
Declaration of Competing Interest
The authors declare that they have no known competing financial interests or personal relationships that could have appeared to influence the work reported in this paper.
References
-
1.
Liu ZD, Cheng ZZ, He XK, Bao H. Systematical innovation of heat resistant materials used for 630~700 °C advanced ultra-supercritical (A-USC) fossil fired boilers.
Acta Metall. Sin. 2020,
56, 539–548.
[Google Scholar]
-
2.
He HS, Yu LM, Liu CX, Li H, Gao Q, Liu Y. Research progress of a novel martensitic heat-resistant steel G115.
Acta Metall. Sin. 2022,
58, 311–323.
[Google Scholar]
-
3.
Xia XX, Zhu BY, Jin X, Tang M, Yang L, Xue F, et al. Analysis on microstructure and properties evolution and life prediction of P92 steel in high temperature service.
Int. J. Pres. Ves. Pip. 2021,
194, 104482.
[Google Scholar]
-
4.
Nie M, Zhang J, Huang F, Liu JW, Zhu XK, Chen ZL, et al. Microstructure evolution and life assessment of T92 steel during long-term creep.
J. Alloys Compd. 2014,
588, 348–356.
[Google Scholar]
-
5.
Pandey C, Mahapatra MM, Kumar P, Thakre JG, Saini N. Role of evolving microstructure on the mechanical behaviour of P92 steel welded joint in as-welded and post weld heat treated state.
J. Mater. Process. Technol. 2019,
263, 241–255.
[Google Scholar]
-
6.
Maruyama K, Sekido N, Yoshimi K. Changes in strengthening mechanisms in creep of 9Cr-1.8W-0.5Mo-VNb steel tested over wide ranges of creep conditions.
Int. J. Pres. Ves. Pip. 2021,
190, 104312.
[Google Scholar]
-
7.
Xiao B, Xu L, Zhao L, Jing H, Han Y. Deformation-mechanism-based creep model and damage mechanism of G115 steel over a wide stress range.
Mater. Sci. Eng. A-Struct. Mater. Prop. Microstruct. Process. 2019,
743, 280–293.
[Google Scholar]
-
8.
Yu Y, Liu Z, Zhang C, Fan Z, Chen Z, Bao H, et al. Correlation of creep fracture lifetime with microstructure evolution and cavity behaviors in G115 martensitic heat-resistant steel.
Mater. Sci. Eng. A-Struct. Mater. Proper. Microstruct. Proces. 2020,
788, 139468.
[Google Scholar]
-
9.
Lee JS, Armaki HG, Maruyama K, Muraki T, Asahi H. Causes of breakdown of creep strength in 9Cr-1.8W-0.5Mo-VNb steel.
Mater. Sci. Eng. A-Struct. Mater. Proper. Microstruct. Proces. 2006,
428, 270-275.
[Google Scholar]
-
10.
Cheng L, Yu W, Cai QW, Yang Q. Effects of prior austenite grain boundaries on high-temperature fatigue properties of a 2.2Cr heat resistant steel.
Int. J. Fatig. 2021,
148, 106254.
[Google Scholar]
-
11.
Cheng L, Chen YL, Gu XF, Yu W, Cai QW, Suzuki K, et al. A quasi in-situ study on the deformation mechanism in a 2.2Cr heat resistant steel.
Mater. Sci. Eng. A-Struct. Mater. Proper. Microstruct. Proces. 2020,
788, 139557.
[Google Scholar]
-
12.
Abe F. Effect of boron on microstructure and creep strength ofadvanced ferritic power plant steels.
Proc. Eng. 2011,
10, 94–99.
[Google Scholar]
-
13.
Sakthivel T, Das CR, Laha K, Sasikala G. Creep properties of intercritical heat treated boron added modified 9Cr-1Mo steel.
Met. Mater. Int. 2021,
27, 328–336.
[Google Scholar]
-
14.
Liu Z. Effect of Tungsten and Boron on Microstructure and Properties of G115 New Martensitic Heat Resistant Steel. Ph.D. Thesis, University of Science and Technology Beijing, Beijing, China, 2019.
-
15.
Xu Z, Shen Y, Shang Z, Zhang C, Huang X. Precipitate phases in ferritic/martensitic steel P92 after thermomechanical treatment.
J. Nucl. Mater. 2018,
509, 355–365.
[Google Scholar]
-
16.
Shen Y, Shang Z, Xu Z, Liu W, Huang X, Liu H. The nature of nano-sized precipitates in ferritic/martensitic steel P92 produced by thermomechanical treatment.
Mater. Charact. 2016,
119, 13–23.
[Google Scholar]
-
17.
Zhang CQ, Xu ZQ, Shang ZX. Formation mechanism of precipitate phases in ferritic/martensitic steel P92 during thermomechanical treatment.
Heat Treat. Met. 2019,
44, 1–6.
[Google Scholar]
-
18.
Li S, Eliniyaz Z, Sun F, Shen Y, Zhang L, Shan A. Effect of thermo-mechanical treatment on microstructure and mechanical properties of P92 heat resistant steel.
Mater. Sci. Eng. A-Struct. Mater. Prop. Microstruct. Process. 2013,
559, 882–888.
[Google Scholar]
-
19.
Alsagabi S. High temperature deformation behavior of p92 steel.
Trans. Indian Inst. Met. 2016,
69, 1513–1518.
[Google Scholar]
-
20.
Obiko J, Chown LH, Whitefield DJ. Warm deformation behaviour of P92 steel.
Mater. Res. Express 2019,
6, 1265.
[Google Scholar]
-
21.
Song M, Sun C, Fan Z, Chen Y, Zhu R, Yu KY, et al. A roadmap for tailoring the strength and ductility of ferritic/martensitic T91 steel via thermo-mechanical treatment.
Acta Mater. 2016,
112, 361–377.
[Google Scholar]
-
22.
Hou SS, Guo GZ, Xiao MX. Study on heat treatment process of P92 ferrite heat-resistant steel for ultra supercritical Units.
Hot Work. Technol. 2020,
49, 138–140.
[Google Scholar]
-
23.
Zhang J, Yu L, Liu C, Ding R, Liu Y. Synergistic strengthening of high-Cr martensitic heat-resistant steel and application of thermo-mechanical treatments.
Acta Metall. Sin. 2024,
60, 713–730.
[Google Scholar]
-
24.
Saini N, Pandey C, Mahapatra MM. Characterization and evaluation of mechanical properties of CSEF P92 steel for varying normalizing temperature.
Mater. Sci. Eng. A-Struct. Mater. Prop. Microstruct. Process. 2017,
688, 250–261.
[Google Scholar]
-
25.
Marandi A, Zarei-Hanzaki R, Zarei-Hanzaki A, Abedi HR. Dynamic recrystallization behavior of new transformation-twinning induced plasticity steel.
Mater. Sci. Eng. A-Struct. Mater. Prop. Microstruct. Process. 2014,
607, 397–408.
[Google Scholar]
-
26.
Zhao YT, Du HQ, Tian YP. Short-time high-temperature tensile properties and fracture morphology of P92 steel at home and abroad.
J. Inn. Mong. Univ. Sci. Technoligy 2020,
39, 43–46.
[Google Scholar]
-
27.
Zhao YT, Dong JH, Zhang SH, Liu ZC, Li WX. High-temperature tensile fracture morphology of P92 steel.
J. Mater. Eng. 2015,
43, 85–91.
[Google Scholar]
-
28.
Saini N, Mulik RS, Mahapatra MM. Study on the effect of ageing on laves phase evolution and their effect on mechanical properties of P92 steel.
Mater. Sci. Eng. A-Struct. Mater. Prop. Microstruct. Process. 2018,
716, 179–188.
[Google Scholar]
-
29.
Lin J, Chen G, Zhang JN. Study on high-temperature creep rupture test and microstructure evolution of P92 steel pipe.
Steel Pipe 2022,
51, 30–33.
[Google Scholar]
-
30.
Kang H. The Effect of the Second Phase Particles on the Creep and Fracture Properties of P92 Heat-Resistant Steel. Ph.D. Thesis, Tianjin University of Technology, Tianjin, China, 2021.
-
31.
Huang Y, Gao H, Nix WD, Hutchinson J. Mechanism-based strain gradient plasticity-II. Analysis.
J. Mech. Phys. Solids 2000,
48, 99–128.
[Google Scholar]
-
32.
Kubin LP, Mortensen A. Geometrically necessary dislocations and strain-gradient plasticity: a few critical issues.
Scr. Mater. 2003,
48, 119–125.
[Google Scholar]
-
33.
Bakhshi S, Mirak A. Textural development, martensite lath formation and mechanical properties variation of a super strength AISI4340 steel due to austenitization and tempering temperature changes.
Mater. Charact. 2022,
188, 111923.
[Google Scholar]
-
34.
Shamsdini S, Pirgazi H, Ghoncheh MH, Sanjari M, Amirkhiz BS, Kestens L, et al. A relationship between the build and texture orientation in tensile loading of the additively manufactured maraging steels.
Add. Manuf. 2021,
41, 101954.
[Google Scholar]
-
35.
de Moura AN, Neto CAR, Castro NA, Vieira EA, Orlando MTDA. Microstructure, crystallographic texture and strain hardening behavior in hot tensile tests of UNS S32304 Lean Duplex stainless steel.
J. Mater. Res. Technol. JmrT 2021,
12, 1065–1079.
[Google Scholar]
-
36.
Cai M, Wei X, Rolfe B, Hodgson PD. Microstructure and texture evolution during tensile deformation of symmetric/asymmetric-rolled low carbon microalloyed steel.
Mater. Sci. Eng. A-Struct. Mater. Prop. Microstruct. Process. 2015,
641, 297–304.
[Google Scholar]