1. Introduction
Climate change is a current issue causing a lot of problematic consequences but also boosting interest in designing modern, novel, financially feasible [
1] and industry-changing solutions [
2,
3]. In the digitalized era [
4], we have achieved a lot in assets management [
5], had new ways to be able to utilize crowd resources [
6], do economical and ecological waste and emissions reduction [
7,
8], and more sustainable supply chains and their evaluation [
9], in general, and university—industry collaboration for more sustainable solutions [
10,
11], development in textile industry [
12] and, e.g., in recycling too [
13]. But on the other hand, e.g., food production is endangered by shifting weather patterns and rising sea levels, causing floods,
etc. Without fast actions, better formalization of innovation fronts [
14], and novel & less emissions-making solutions to our lifestyles, emissions, and waste makings [
15,
16], these impacts will be devastating and global in scope and unprecedented in scale [
17,
18,
19,
20,
21,
22]. As expected, the importance of environmental issues in society [
23], the role of companies of all sizes, including micro, SMEs [
24], and large companies alike, is growing, and more actions are also taken and still need to be taken into consideration within the construction industry. Concrete is the world’s most widely used building material [
25], thus at the heart of the environmental debate. Concrete production is the third largest producer of CO
2 emissions globally and we need to find new ways to reduce these emissions in global scale [
26].
Concrete-related CO
2 emissions mostly come from the cement industry’s cement-making process, when raw materials are converted to Portland cement, or so-called ordinary Portland cement (OPC). The traditional OPC cement is the major global standard cement product made from a limestone and clay mixture. This mixture is pyrolysed in a hot kiln at temperatures around 1450 °C. The kiln-heated product/powder is blended with case-specific additives [
27,
28] to achieve the desired product structure. Considering the CO
2 emissions in the global clinker production, projected to reach over 5 billion tons by 2030, the typical chemical reactions go as follows:
Equation (1). Typical cement CO
2 emissions source from a chemical reactions point of view.
The general view is that the CO
2 emissions produced in this production process are in the range of 0.5–0.9 kg per 1 kg of produced clinker produced [
29,
30,
31]. Basically, all commercial buildings like to utilize and need durable and high-strength floors for their operation’s, including modern sustainable and long-term use designed warehouses [
32]. These facilities producers are seeking options to help them to reduce buildings-related emissions in addition to the operations related emissions and professional concentration in sustainability operations issues [
33,
34]. At the same time, when we try to solve our global food insecurity issues [
17], we could be seeking symbiotic solutiosn to utilize food production side stresms for more sustainable concrete mizs [
35]. But in short, from an emissions perceptive, it is just the current basic reality that concrete cannot be produced without cement, and the cement industry alone produces three times more CO
2 emissions than, for example, the aviation industry [
36]. It has been represented that cement produces eight percent of the world’s CO
2 emissions on a yearly basis [
37]. As cement production is vast, emission reductions in concrete production can achieve significant results in global climate change mitigation activities. Also, in a bigger picture, heat and power creation-related emissions should be taken into account [
38], the solution development should consider both, the sharing of the archived gains but also the pains [
39] and in addition of the material efficiency and low-carbon products to be able to reduce product-driven emissions, in a big picture [
40].
The goal of the study was to compare different concrete based flooring options with different lifetime CO
2 emission rates, including floor renewal into the life cycle CO
2 emissions rates. As for performance and de-facto industry standard comparison items, we also added epoxy-based flooring [
41] as an option to give a clear impression of how different options and widely used typical plastics based solution, do actually compare to each other, from sustainability and emissions points of view. The study was made as this is one of the first studies on the area of comparing multiple different flooring options, where sustainable concrete floor topping is put against high industry-used epoxy options, even though it is well known in the industry that this surface option might need special treatment, e.g., anti-slippery purposes [
42,
43] and especially a heavy use (a lot of movement on top of the surface) will make the epoxy option to be damaged easily and in quite fast phase too, in addition to making a specially strong ponding epoxy floor, on top of a base concrete slab, one might need expensive special epoxy resins [
44,
45].
2. Research Methodology, Objectives and Limitations
For realistic concrete floor emissions production in the floor’s lifetime, the authors have created a model to calculate the CO
2 emissions of concrete floor construction for industrial purposes. The goal was to compare created CO
2 emissions from two different floor toppings: epoxy and case company’s specific mineral and cement mix-based dry shake hard topping.
The analysis focused on a concrete floor for industrial warehouses, large halls, and similar spaces. For this purpose, the model uses 10,000 m
2 as a fixed parameter, which makes results comparison and scaling to, e.g., larger spaces with simple multipliers an easy task. Analysis includes three different concrete mixes CEM1, CEM3a, and CEM3b, which are presented in
. These mixes are analyzed together with two different coating options: epoxy coating and the mentioned special coating, which, for simplicity purposes, will now be referred to as dry shake-based coating in the following chapters. For calculations, CO
2 emissions from energy usage and transportation were excluded. This decision was made due to their CO
2 emissions to be immaterial/negligible compared to CO
2 emissions from cement production [
46]. Additionally, the estimated CO
2 emissions from energy usage and transportation are very similar for the investigated options. The costs of these solutions have also been excluded. However, the greener and less polluting options tend to be currently a bit more expensive, and thus the transition into those takes time. On another hand, legislation, sustainability related positive brand effects, and changes in industrial sustainability trends [
47] can outweigh the cost matters. The article uses a narrative literature review and Excel-based scenario modeling as its methodology.
.
Typical cement descriptions and emission rates are based on sources [48,49].
|
Portland/CEM1 |
CEM3a |
CEM3b |
Cement
description
|
A “pure” cement,
Ordinary Portland cement
|
A blend of traditional cement 30 percent of fly ash |
A blend of traditional cement 50 percent of GGBS |
| CO2 emissions |
295 kg CO2/m3 |
245 kg CO2/m3 |
175 kg CO2/m3 |
3. Theory and Background
With a study of current literature, a researcher can “acquire an understanding of what has already been done, how it has been researched, and what the key issues are” [
50]. Theory and background also help to introduce the study’s contributions and justify its approaches, research methods, tools, questions, and methods [
51].
As a methodology, a narrative literature review summarizes previously published information on a topic of interest. It focuses on concepts, theories, research methods, and research outcomes [
52]. It is developed to provide a concise overview of a certain issue in a relatively short period [
53,
54]. Narrative reviews often serve as an applicable starting point for future research developments, and it has been found helpful in determining and refining research questions or hypotheses [
55]. The narrative literature review was conducted with a snowballing method, where information is collected by including relevant articles selected from a reference list of a certain starting set of articles. In short, in the snowballing method, a starting set of articles is used as a selection pool for other articles, as other relevant articles are searched from the reference list of the starting set of papers by reviewing their content and potential contribution to the ongoing research [
56].
4. Research Specific Supportive Literature
For industrial floors, certain unique requirements can be present, as the floor surface needs to be, e.g., dust-free and easy to clean, but most importantly, heavily durable. Usually, all industrial floors are made from concrete, but it is enhanced with different methods to retain its precedence over time [
57]. This report focuses on analyzing the environmental impacts of three different concrete floor options with the case company’s specific mineral and cement mix, hard topping, and epoxy coating. Thus, only these are briefly introduced. About ten billion cubic meters of concrete are used in the world every year. The environmental impacts are due to the vast amounts of concrete produced. On the other hand, it enables, among other things, the production of emission-free energy from wind, hydro, and nuclear power plants, as well as the construction of safe, long-lasting, and valuable housing and other buildings. And the concrete and cement industries have not been inactive in terms of emission reductions. The sector’s climate emissions have been reduced by almost 25 percent over the past decade compared to the 1990 reference year [
12].
Epoxy resins are classified as plastic; like other plastics, they are made from oil [
57]. As epoxy resin is made from fossil fuel resources, thus the production of epoxy resin causes a lot of CO
2 emissions [
58]. Additionally, epoxy resins are challenging to recycle as commonly it is used only in small amounts, such as adhesives or coatings. Currently, recycling a layer of coating is not feasible, either technologically or economically [
59].
5. Modeling and Scenario Analysis
Due to the vast amount of CO
2 emissions in the concrete industry, the target is to analyze how the selected concrete base and topping affect the CO
2 emissions. There are different solutions to build the floor, but there are construction standards that serve certain density and strength requirements. These standards limit the number of different options for construction. Additional industrial floor requirements, like previously mentioned dust-free, durable, and long-lasting, set their own option limits. Taking these properties into account, our study analyzed how different concrete slab and surface coating combinations produce CO
2 emissions with either of the top surface materials: epoxy coating or dry shake-based coating.
Concrete slab options are presented in
in the first chapter. These were chosen for the analysis as the requirement for concrete is globally so vast, and there is just not enough slag to produce less emissive concrete slabs for everyone, to fulfill all global demand. Due to this, the article analyzes Portland/CEM1 concrete slab pairing with a less pollutive coating option. Currently, epoxy coating is widely used in the industrial sector; thus, it was a natural and optional choice for the analysis. Additionally, the studied dry shake option promises a lot in paper and, as such, wanted to be compared to the epoxy coating option. This analysis gives insight into how these coating options may affect whole floors CO
2 emissions. Epoxy coating might be an easy and affordable option, but it will require maintenance activities. Cost-wise, CEM3b concrete slab with epoxy coating could be utilized in industrial halls that have low utilization rates and do not see the use of heavy vehicles. In short, CO
2 emissions can vary a lot, and the target was to model these variances in an analytical way.
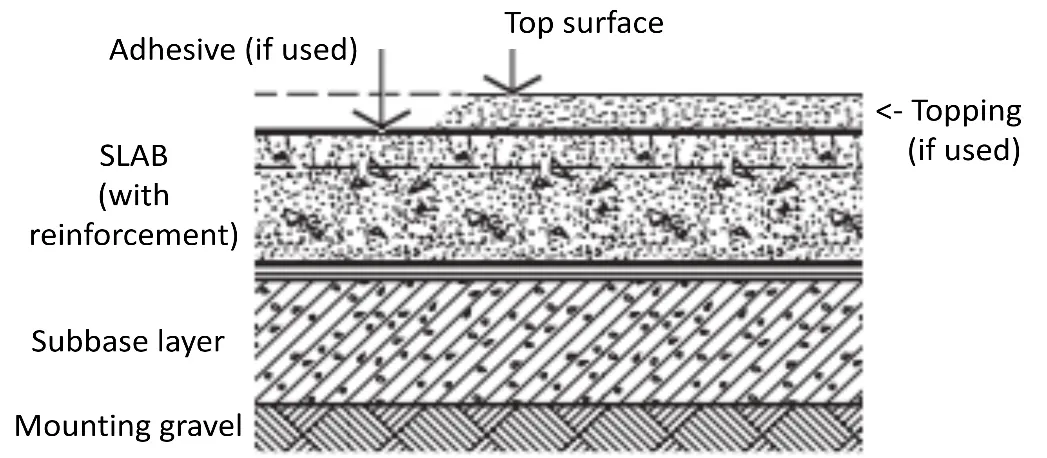
6. Industrial Floor Structure
Industrial floors are often constructed, as presented in
. On top of the soil, there is mounting and leveling gravel to create a flat base for the concrete slab and layers on top of the gravel. Our study focuses on calculating the CO
2 emissions for the concrete slab and the thin top surface layer on top of the base slab. Concrete acts as a base layer in this study as it is the most common industrial flooring option. Concrete is commonly confused with one of its constituents, cement. However, cement is the most important constituent as it is part of “the glue” that holds the other materials together. Concrete is made by mixing cement, other cementitious materials, water, fine aggregates, and coarse aggregates together. Coarse aggregate may also include admixtures, reinforcement, fibers, or pigments [
60].
. Cross section of a concrete floor structure.
Reducing CO
2 emissions is possible by replacing Portland cement with other materials such as GGBS, fly ash, micro-silica, glass, limestone powder, and chimney clay [
61]. Here, GGBS (Ground Granulated Blast-furnace Slag) is a cementitious material whose main use is in concrete and is a by-product of the blast furnaces used to make iron [
62]. These blast furnaces operate at temperatures of about 1500 °C and are fed with a carefully controlled mixture of iron ore, coke, and limestone. The iron ore is reduced to iron, and the remaining materials form a slag that floats on top of the iron. This slag is periodically tapped off as a molten liquid. In case it will be used for making GGBS, it has to be rapidly quenched in large volumes of water. The quenching optimizes the cementitious properties and produces granules similar to coarse sand. This ‘granulated’ slag is then dried and ground to a fine powder. Although normally designated as ‘GGBS’, it can also be referred to as ‘GGBFS’ or ‘slag cement’.
The strength development of these sustainable concrete mixes tends to be slower than CEM I or CEM II types of cements. This means a longer mold release time or, heat treatment, or accelerator recovery [
63]. A report by BIBM suggests, as a rule of thumb, that substituting 50 percent of cement with GGBS equals 40 percent less CO
2 emissions, and substituting 30 percent of cement with PFA equals 20 percent less CO
2 emissions [
61]. In Finland, the construction industry has not been aggressive with the implementation of concrete mix products, as the first CEM type III cement did not enter the market until 2021 [
63]. There are different types of concrete mixes, of which Portland/CEM1, CEM3a, and CEM3b are analyzed in this report. Portland/CEM1 is the common cement type widely used in the construction industry.
Floor coatings have traditionally been used in secondary spaces, such as engine rooms or spaces where the functional characteristics of the floor play a much more important role than the appearance. A traditional example would be an industrial hall. In these locations, the floor coating is usually installed directly on top of the concrete base. The coatings are relatively thin and align with the shape of its platform, in which case the concrete base flatness requirements will put some pressure on base slab producers. Also, paint-like coatings, including epoxy-based coating, tend to highlight the defects of the concrete base. To achieve a flat and desired outlook, the casting and surface treatment of the underlying concrete base must be done with particular care and in favorable conditions. As poorly done leveling work may ruin the floor, in some cases, screeds are also used [
64]. However, screeds are not included in this report’s CO
2 calculations.
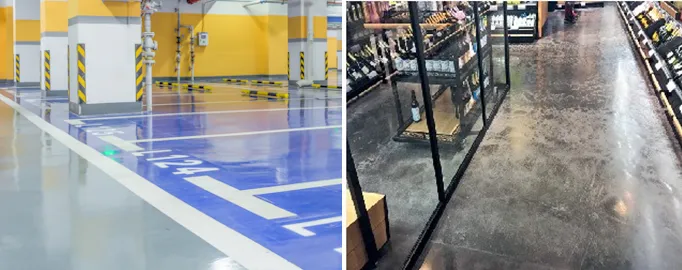
Polymer coatings are liquid coatings that utilize epoxy, polyurethane, and acrylic polymer or a cement polymer blend as a binder. The polymer mass consists of two or more distinct phases: a polymer that acts as a binder and a granular component as an aggregate. The aggregate may be natural, quartz, or a wear-resistant mineral such as corundum. Coated floors are concrete floors where the surface has been created as a polymer product to improve the durability and properties of the floor. Polymer mass coating provides a durable, seamless floor. Types of coatings include cement polymer mass, abrasive mass, self-leveling compound, and solvent-free coating. This article analyzes ground epoxy mass as a polymer coating product as it is one of the industrial halls’ most durable and frequently utilized polymer products. Ground epoxy coating is suitable for medium and heavy use; see the example in
. Medium refers to regular walking, repetitive truck traffic, and occasional plastic wheeled carts, and heavy refers to continuous truck traffic, carts with hard plastic wheels, and occasional knocks [
65].
. (<b>Left</b>): An example of an epoxy coating in a public space (Image by evening_tao on Freepik) and (<b>Right</b>): An example of a dry shake-based floor in a public space.
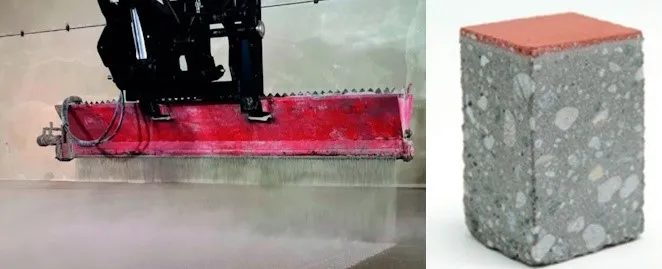
A dry shake is a concrete product without any water. It includes cement and a variety of hard aggregates. A dry shake is applied on top of the fresh concrete base, and it absorbs the water required from the underlying concrete mass. Dry shake can be applied to the concrete base in several different ways. Traditional method utilizes a sled, which is pushed on the casting surface, and the dry shake drains from the sled to the concrete base. In small locations, the dry shake can be applied by hand tossing and leveling. In larger construction sites, the contractors have a spreader attached to the reach stacker, see
. The advantage of this method is that the dry shake can be applied to the concrete base earlier, thus ensuring enough water for the cement reaction. With manual hand tossing methods, the dry shake cannot be applied before the concrete base has hardened enough that it allows walking on top of it, and thus, it creates a risk that the concrete has dried too much. Finally, a dry shake is ground on top of the concrete base, creating a homogeneous structure; thus, some may suggest that it is not a separate coating product [
66].
includes an example cross-section of a dry shake hardener floor.
includes an example of a dry shake-based floor in a public space.
The study’s dry shake-based floor topping provides strong and nearly maintenance-free floor solutions for industrial purposes. Dry shake-based floor topping is made of Portland (CEM1) cement, also including hard and coarse aggregates, polypropylene microfibers, and additives. During installation, nano-silica is applied, which creates a surface that is denser and harder and improves bonding. Plastic shrinkage and delamination can be minimized with polypropylene fibers and the case company’s installation method, which can enhance glossier finish creation together. With a durable and smooth surface, there is less forklift tire wear, and the floor is easier to maintain in its lifetime.
. (<b>Left</b>): dry shake topping spreader applying dry shake and (<b>Right</b>): an example of a dry shake hardener floor in a public space.
7. Carbon Emission Factors for Cement and Concrete
Carbon emission factors collection was challenged by mixed CO
2 emission data available for both cement and concrete. Data was provided in mixed units such as kg CO
2/kg, kg CO
2/tn, and kg CO
2/m
3. Average CO
2 emissions for cement in the UK changed from 668 kg/tn (Weighted average) of all cementitious in UK (includes CEM 1, 2, 3, 4 cements and GGBS and fly ash) to 820 kg/tn (Weighted average) of all factory-made cement in the UK and different mixes for concrete change from 72.5 kg/tn to 157 kg/tn. For CEM1 Portland cement, the values were between 860 kg CO
2/tn and 910 kg CO
2/tn, CEM3a between 480 kg CO
2/tn and 594 kg CO
2/tn, and for CEM3b between 232 kg CO
2/tn and 362 kg CO
2/tn [
49,
67,
68,
69,
70]. For simplicity, in the model, it was decided to use Concrete Centre’s values [
49] for ground floors as those are suitable for industrial flooring as they are already reinforced with steel, and the values were already in cubic meters. CEM1 concrete 295 kg CO
2/m
3, CEM3a 245 kg CO
2/m
3 and CEM3b 175 kg CO
2/m
3.
The difference between cement and concrete emissions levels relates to the fact that concrete includes only about 10 percent cement, other materials are air, water, fine aggregate, and coarse aggregate. As concrete includes mainly, about 70 percent, fine and coarse aggregates such as sand, crushed rock, stone, and gravel, which CO
2 emissions are immaterial/negligible, thus the total CO
2 emission level decreases [
49].
8. Introducing the Model
The following introduces the model to calculate CO
2 emissions in an industrial floor context. The model for CO
2 emissions includes the initial construction of an industrial hall floor, and the maintenance time emissions are calculated based on the data gathered from research phase literature review sources and company interviews. Parameters that were received from the company or were given to limit the number of changeable parameters are the following: Size of industrial floor 10,000 m
2; Depth of the concrete slab 12 cm; Concrete weight 2500 kg/m
3; Time period up to 50 years; An epoxy surface maintenance period every four, six, or eight years and an epoxy surface maintenance cycle related exchange amount need set to 30 percent.
The area to be covered is 10,000 m
2 and the concrete element weight is estimated at 2500 kg per m
3 and slab thickness at 12 cm. The epoxy coating requires maintenance from time to time and it is suggested that the floor should be maintained every ten years [
57]. The model uses a more careful maintenance period of eight years instead of 10 years. Re-grounding requires, at minimum, removing at least 0.5 mm of coating with a grinding machine. In typical industry cases tough, surface is damaged deeper than just barely half a mm.
To get back to the original surface quality level, most used passageway areas have to be removed completely, and less utilized but, e.g., chemically/mechanically damaged areas have to be ground up to a level where good base coating with tight contact to the base slab is encountered. For this particular model, a typical industrial case of removal of around 30% of the original mass of epoxy was estimated to cover all resurfacing needs. Averaged out for the whole surface, it would equal 0.9 mm in depth in this model.
Based on these parameters, the concrete requirement is 1200 m
3 to cover the floor area. CO
2 emissions for steel reinforced concrete suitable for ground floors are 175–295 kg/m
3, depending on the concrete quality, as shown in
. As
shows, CO
2 emissions from concrete deviate from 210 tn to 354 tn. These concrete bases are applied with both topping options to analyze CO
2 emissions from two different floor options with three different concrete base options.
.
CO2 emission from different concrete mixes.
|
Portland/CEM1 |
CEM3a |
CEMb |
| CO2 emission factor (kg CO2/m3) |
295 |
245 |
175 |
| Concrete weight (kg/m3) |
2500 |
2500 |
2500 |
| CO2 emission factor (kg CO2/kg) |
0.118 |
0.098 |
0.070 |
| Concrete requirement (m3) |
1200 |
1200 |
1200 |
| Concrete CO2 (kg) |
354,000 |
294,000 |
210,000 |
To ensure a durable industrial floor, a recommended coating thickness is at least three mm. Based on research, 3 mm layer requires 5.4 kg per m
2 of epoxy [
57]. In the model, the thickness of the epoxy floor coating is a changeable parameter, and thus the requirement for a one mm layer needed to be calculated. Based on the calculation, the requirement for one mm layer of epoxy floor coating is 1.8 kg/m
2. As the area to be covered is 10,000 m
2, the CO
2 emissions are 102.6 tn, as the above
shows. The requirement of the dry shake is five kg/m
2, of which cement is 35 percent, 1.75 kg/m
2. Considering that the emission factor for CEM1 cement is 0.91 kg CO
2/kg, the case company’s specific mineral and cement mix causes CO
2 emissions of 15.9 tn, as shown in the above
. Other dry shake-based floor topping materials have not been included in the analysis as their emissions are immaterial/negligible compared to everything else.
.
CO2e from epoxy coating.
| CO2 emission factor (kg CO2/kg) 1.90 |
| Epoxy requirement for initial coating 5.40 kg/m2 |
| CO2 epoxy coating 10.26 kg/m2 |
| CO2e (kg) for total floor area 102,600 |
.
CO2e from dry shake floor coating.
| Cement emission factor (kg CO2/kg) 0.91 |
| Cement requirement 1.75 kg/m2 |
| CO2 cement 1.59 kg/m2 |
| CO2e (kg) for total floor area 15,925 |
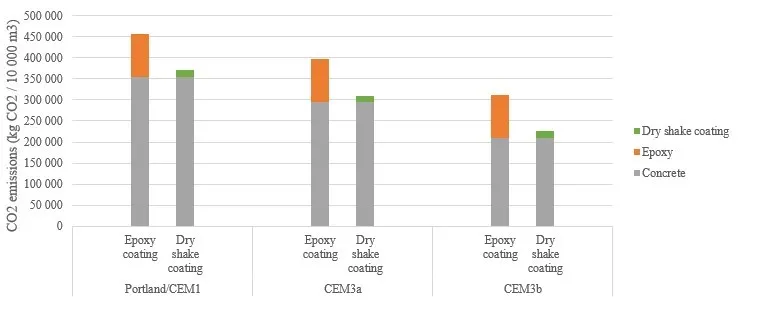
shows CO
2 emissions for both toppings, epoxy coating, and case company’s dry shake-based floor coating with different concrete base options, Portland/CEM1, CEM3a, and CEM3b. It shows that the CO
2 emissions are higher for epoxy than for the case company’s dry shake-based floor coating, and it also shows that CO
2 emissions decrease when the concrete base includes more fly ash or GGBS instead of cement, meaning CEM3a or CEM3b is used instead of Portland/CEM1. The total CO
2 emissions can be affected in different ways depending on the requirements for the industrial floor in question. A simple way is to use less pollutive coating, such as the modeled dry shake-based floor coating, instead of epoxy coating. Even bigger effect is achievable, in the total CO
2 emissions viewpoint, by utilizing concrete mixes that use secondary source cementitious materials, like is the case with CEM3 cements.
. CO<sub>2</sub> emissions for different industrial floors (excl. maintenance).
Maintaining the floor requires the removal of the whole surface, averaging 0.9 mm of the surface coating. After that, a new one mm layer of epoxy floor coating is added, which requires 1.8 kg of epoxy floor coating per m
2.
shows that each maintenance round causes 34.2 tn CO
2 emissions, and within a 50-year timeline, the floor requires maintenance six times in this 50 years’ time, which means a total of 205.2 tn CO
2 emissions for the given timeline. The model did not include the emissions from energy usage of the grinding machine as it is not considered a major source of CO
2 emissions, compared to the used and needed epoxy-related emissions.
.
CO2 emissions from maintenance with 8-year maintenance period.
| Maintenance Period |
Eight Years |
| Epoxy requirement for maintenance |
1.8 kg/m2 |
| CO2 emissions for epoxy coating in maintenance |
3.42 kg CO2/m2 |
| CO2 (kg) for a total floor area of 10,000 m2 |
34,200 |
| Maintenance times during a period |
6.0 |
| CO2 emissions (kg) for total floor area (during lifetime) |
205,200 |
9. Results and Analysis
The following analyses model-based results for the CO
2 emissions for different industrial floor solutions. We also present the findings based on the model and the differences between the compared solutions. The analysis is concluded by describing the most favorable solutions based on low CO
2 emissions.
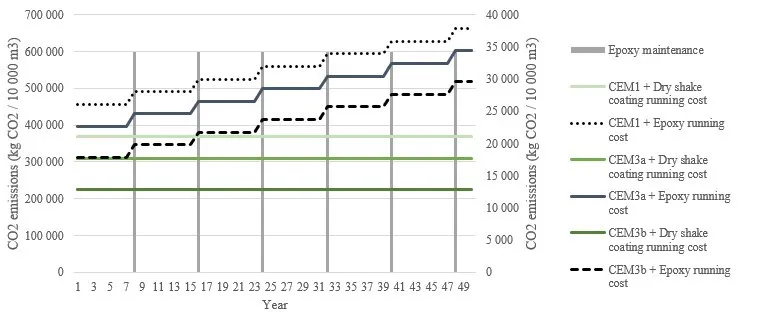
Figure 5 shows how different concrete options add up as CO
2 emissions within an eight-year maintenance period for the epoxy surface. Black lines represent floors with epoxy coating and green lines floors with the modeled dry shake-based floor topping. Grey bars represent CO
2 emissions for each maintenance round. When the maintenance period is decreased to six or four years, the total CO
2 emissions increase as there are more maintenance rounds during the floor’s lifetime, as presented in
Figure 6 and
Figure 7.
Figure 5. Comparison of CO<sub>2</sub> emissions from Case Company’s dry shake-based floor topping and Epoxy coating with 8-year maintenance period.
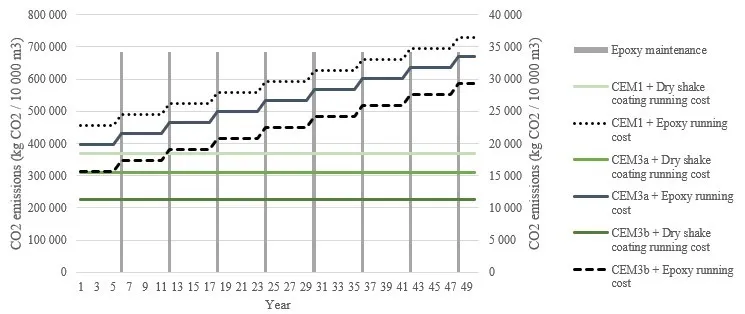
Figure 6. Comparison of CO<sub>2</sub> emissions from Case Company’s dry shake-based floor topping and Epoxy coating with 6-year maintenance period.
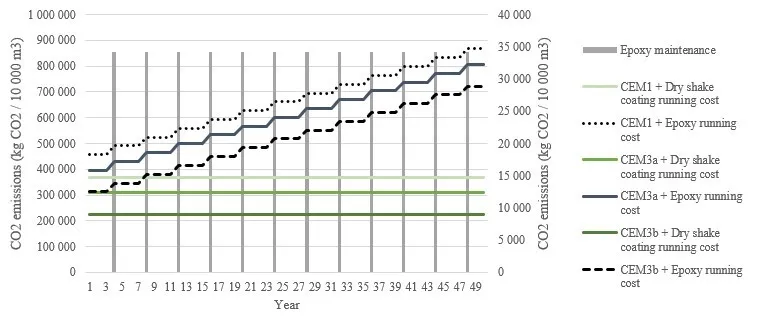
Figure 7. Comparison of CO<sub>2</sub> emissions from Case Company’s dry shake-based floor topping and Epoxy coating with 4-year maintenance period.
10. Deeper Look to the Modeled Results
As shown in the previous
Figure 4, the base slab causes most of the CO
2 emissions of the modelled floor. With the Portland/CEM1 base slab, the CO
2 emissions are the highest, causing 350 tn CO
2 emissions when the floor base is created. If CEM3a is used, a mix that includes 30 percent of fly ash, the CO
2 emissions decrease by more than 50 tn to 294 tn. If CEM3b is used, a mix that includes 50 percent GGBS, the CO
2 emissions are substantially lower than with CEM1, at 210 tn. When coating options are included in the analysis, the difference becomes even larger.
Figure 4 also shows that the epoxy floor coating causes 102.6 tn CO
2 emissions when the floor is initially covered, whereas the dry shake-based floor topping causes only 15.89 tn CO
2 emissions when the concrete is coated. When these CO
2 emissions are added on top of the CO
2 emissions from the concrete base, the most polluting option, Portland/CEM1 concrete base with epoxy coating, causes a total of 456.6 tn of CO
2 emissions, and the most sustainable option, CEM3b with the modeled dry shake-based floor topping, only about half of the previously mentioned most polluting option, resulting just 225.9 tn of emissions.
Figure 4 shows that the total CO2 emissions are higher for an epoxy coating with CEM3a slab than the dry shake-based floor topping option with Portland/CEM1 base slab. Additionally, Epoxy coating with CEM3b has about as high CO
2 emissions as the modeled dry shake-based floor topping with CEM3a. Notice, that these CO
2 emissions represent the emissions that are already realized when the floor is initially constructed and thus do not include CO
2 emissions from maintaining the floor within its lifetime.
With lifetime modeling, the epoxy coating option becomes less sustainable with time. When the floor maintenance is included in the analysis, each maintenance round causes 35 tn CO
2 emissions (
Table 5). In the model, analyses of CO
2 emissions for the epoxy coating maintenance cycle were made for 8-, 6- and 4- years’ time cycles. The modeled dry shake-based floor topping does not require any surface grinding and resurfacing maintenance.
Figure 5 reveals that at the end of the 50-year time frame, the total CO
2 emissions for epoxy floors with CEM1 to CEM3b bases is from 518 tn to 662 tn, with an epoxy coating maintenance cycle of 8 years.
Figure 5 also shows that the only case where epoxy coating does fewer emissions than dry shake-based floor is the case with CEM3b concrete base slab, and this only happens when compared to the most emissive (worst case) dry shake-based floor topping option with Portland/CEM1 concrete base, and only in the beginning of the process, before any maintenance is done. However, after the second maintenance round, 16 years after construction, the epoxy option exceeded the CO
2 emissions, compared to the dry shake floor topping floor, as the dry shake-based floor topping did not cause any CO
2 emissions after it was initially constructed.
When maintenance is required every six years, the CO
2 emissions will of course, get higher, as there will be additional maintenance rounds.
Figure 6 reveals that at the end of the 50-year time frame, the total CO
2 emissions for epoxy floors with different concrete bases change from 586 tn to 730 tn. Epoxy coating with CEM3b concrete layer becomes more polluting than the modeled dry shake-based floor topping option with Portland/CEM1 concrete base, once again, after the second maintenance round, which is already happening in year 12. When maintenance is done every four years, the break-even point with the dry shake-based floor topping is already at eight years. After that, the epoxy coating, even with CEM3b base slab, generates more CO
2 emissions. The total CO
2 emissions deviate from 723 tn to 867 tn, as shown in
Figure 7.
Table 6 shows total CO
2 emissions from the entire 50-year time frame for all product combinations. It also shows how the maintenance periods affect the amount of CO
2 emissions. It reveals that within the 50-year time frame, dry shake-based option will always be more sustainable, causing less CO
2 emissions than an epoxy coating, especially thanks to its expected maintenance-free lifetime of 50 years.
Table 6.
The total CO2 emissions from a 50-year time frame.
|
Epoxy Coating |
|
Dry Shake-Based Coating |
|
|
Portland/CEM1 CEM3a |
CEM3b |
Portland/CEM1 CEM3a |
CEM3b |
| Four years |
867 tn |
807 tn |
723 tn |
|
|
|
| Six years |
730 tn |
670 tn |
586 tn |
|
|
|
| Eight years |
662 tn |
602 tn |
518 tn |
|
|
|
| No maintenance |
|
|
|
370 tn |
310 tn |
226 tn |
The analysis highlighted the main aspects of the model calculations. However, the fact that cannot be underlined enough is that due to the maintenance, the dry shake-based option gets lower CO
2 emission values with all concrete mixtures in the long-term, which is especially important, as there is no CEM3 available for everyone.
11. Analysis and Discussion
In the model, the industrial floor with different two different coatings, (1) epoxy coating and (2) modeled case company’s dry shake-based floor topping, were compared. Results showed that the dry shake-based floor topping was always a less polluting option compared to epoxy coating, when lifetime maintenance was taken into account. However, a substantial part of the CO2 emissions from industrial floor construction was generated by the concrete base. When CO2 emissions from maintaining the industrial floor were included, the model showed big benefits for the modeled dry shake-based floor topping. This model included fixed parameters such as the size of the industrial floor, base floor slab thickness, epoxy layer thickness, epoxy floor coating maintenance requirement, CO2 emissions of epoxy floor coating, epoxy surface for removal, CO2 emissions of cement and concrete, and the requirement for the modeled dry shake-based floor topping. Changes in any of these parameters would affect the model calculations.
Additionally, the model excluded cement transportation (factory to construction site) related emissions, and emissions from energy usage from grinding the concrete floor before applying the top coating. However, adding these CO2 emissions would most probably increase the CO2 emissions in total, but the emissions would be almost the same for both epoxy coating and the modeled dry shake-based floor topping, within a negligible error margin. As a future development item, the CO2 emission model could be developed to include more fine details, but with current knowledge, it is not expected to change the big picture.
12. Conclusions
The motivation for this study is the fact that the construction industry is currently burdening the environment with a vast amount of concrete production [
71,
72,
73,
74,
75], which could be easened up, with prover awareness additions [
7]. However, concrete is durable and thus a natural choice for construction and, also not easy to replace. All this means that we need to seek every potential option to decarbonize cement and concrete production [
76]. But at the same time, we do have some societal and industry barriers to being sustainable in concrete-related constructions [
77,
78,
79]. Even though there are good options for making concrete less environmentally harmful [
80,
81], the construction industry bases building block elements [
82,
83]. Additionally, on top of concrete slab emissions, one of the most common coating options, epoxy resins, adds their own extra CO
2 emission burden. Epoxy resin production uses fossil fuel bases as the main base element, and recycling epoxy resin coatings is currently considered technically extremely challenging or non-feasible effort to be done and economically non-viable option to be taken, in case there are no major substitutions given for doing that. From these viewpoints, the study has calculated the CO
2 emissions for different concrete and epoxy coating options, looking for solutions that would be less emission-prone, that the most traditional ones, mostly in use at the moment.
The study has presented model-based emissions for different concrete mixes, which are made from the traditional 100 percent Portland cement, CEM3a, and CEM3b options. The CO
2 emissions from these concrete mixes as part of industrial floor total emissions were compared and analyzed. Additionally, the study compared traditional epoxy coating with the more recent and modern novel dry shake-based option as base slab floor coating options. CO
2 emissions for these were collected and a model was created to calculate and compare different options emission rates for multiple different time frames. First, an initial model was created, which was then completed with more detailed data, such as information regarding the maintenance needs, intervals, and assumptions for maintenance depths on those floor coating options. Also, the emissions rates for the epoxy coating option were added, too. After model enhancements, the results were calculated and analyzed to understand further where the underlying realities are in initial and time dimension-related emission rates.
Results show that the concrete-based dry shake option, when compared to epoxy resin, using the exact same base slab, is always a more ecologically friendly option than epoxy coating due to higher CO
2 emissions per unit and more frequent maintenance needs in the case of the epoxy-coated floors. In floor construction, most CO
2 emissions come from the base slab [
84], since the required huge amounts of concrete on it, when compared to sleek and slim coatings on top of the tight base slab. The CO
2 emissions could be lowered by increasing the amount of fly ash or GGBS in the concrete mix. However, as the global required amounts of concrete are huge and thus cause the main part of the CO
2 emissions, but at the same time, there just is not enough more sustainable base slab mixes available for everyone, it is evident that CO
2 reductions should be looked from many different angles and other locations too. More attention is needed to be given to the coating selection and its environmental impacts, while at the same time, we keep studying yet new sustainable concrete mixes for the base slabs [
85,
86,
87]. The choice between these two coating options is a mix of multiple variables-based optimization solutions. It will definitely be based on the properties required for the floor to offer for the intended use purposes. In case the heavy use requirements, such as truck traffic, a lot of warehouse & logistics items storage carts with hard wheels, and occasional hard knocks and hit damages expected to happen [
34], one should look at the dry shake-based options, with any preferred concrete mix based base slab, as these are likely the preferred solutions. It all boils done to the fact that the dry shake-based coating is harder than epoxy, and it has been shown to be overall less pollutive and also requires less maintenance, even in heavy use cases, and the hardness of the surface can even be enhanced with special surface hardening chemicals [
88]. On the other hand, in light use cases, such as regular walking and just occasional plastic wheeled carts movements, maybe the epoxy coating could be seen as a compromise with CEM3b concrete mix to lower the CO
2 emissions, which are going to be negatively affected, because of the petroleum-based raw materials, used in floor epoxy mixes.
A recent model calculates CO
2 emissions for three different types of concrete mixes and for two different floor coating options. Set of new novel sustainable concrete mix solutions, e.g., those which utilize different society waste streams [
89], crack preventive solutions [
90], recycled aggregate concrete mixes [
91], and organic materials like sawdust mixed options [
92]. In addition to the base slab sustainable mixes, studying new coating options would be an interesting addition to future models, as would be wider range of fleet level analysis on transportation and sutainable concrete products management solutions too [
93,
94]. In the details enhancements front, our study did exclude some minuscule emission sources, and emissions which would be basically the same for all the compared cases. These excluded sources, e.g., CO
2 emissions from transport and energy usage, were known to be basically the same for all options compared, but that might not be the case if the model were extended with extraordinary cases. So, suppose a total overall covering CO
2 emissions calculations are needed, or the model is made to include special kinds of base slabs and/or coating options. In that case, these emissions sources should also be included in the analysis process. One example of current technology development is autonomous vehicles [
95], which could be optimized to move in special ways, with special coatings, and as such, also made less destructive for those special top-coated floor surfaces. Lastly, we suggest developing the model to compare the economic impacts too, e.g., to include the prices of the different solutions in the analysis and see how the newest technologies like artificial intelligence (AI) [
96,
97,
98] utilized in traditional industries like the construction industry, could change the emissions and cost structures.
Acknowledgments
Authors would wish to acknowledge the continued support of Concria Oy and LUT University for front line research on reducing global CO2 emissions.
Author Contributions
Conceptualization, P.K. and A.H.; Methodology, P.K. and A.H.; Software, P.K. and A.H.; Validation, G.Á.C. and A.H.; Formal Analysis, P.K.; Investigation, P.K.; Resources, A.H.; Data Curation, P.K.; Writing—Original Draft Preparation, P.K.; Writing—Review & Editing, P.K. and A.H.; Visualization, P.K.; Supervision, A.H.; Project Administration, A.H.; Funding Acquisition, A.H.
Ethics Statement
Not applicable.
Informed Consent Statement
Not applicable.
Data Availability Statement
Not applicable.
Funding
The finalizationg and polishing of the work was supported by the project LOgistiikkalaBRA—LOBRA, Co-funded by the European Union, grand number A81408. International collaboration supported by LUT internationalization fund.
Declaration of Competing Interest
The authors declare that they have no known competing financial interests or personal relationships that could have appeared to influence the work reported in this paper.
References
-
1.
Happonen A, Osta IL, Potdat A, Alcaraz JLG. Financially Feasible and Sustainable—Reviewing Academic Literature on Sustainability Related Investment Studies; Book Publisher International: London, UK, 2021; pp. 1–43. doi:10.9734/bpi/mono/978-93-5547-032-4.
-
2.
Happonen A, Santti U, Auvinen H, Räsänen T, Eskelinen T. Digital age business model innovation for sustainability in University Industry Collaboration Model.
E3S Web Conf. 2020,
211, 04005. doi:10.1051/e3sconf/202021104005.
[Google Scholar]
-
3.
Eskelinen T, Räsänen T, Santti U, Happonen A, Kajanus M. Designing a Business Model for Environmental Monitoring Services Using Fast MCDS Innovation Support Tools.
Technol. Innov. Manag. Rev. 2017,
7, 36–46. doi:10.22215/timreview/1119.
[Google Scholar]
-
4.
Oubrahim I, Sefiani N, Happonen A. The Influence of Digital Transformation and Supply Chain Integration on Overall Sustainable Supply Chain Performance: An Empirical Analysis from Manufacturing Companies in Morocco.
Energies 2023,
16, 1004. doi:10.3390/en16021004.
[Google Scholar]
-
5.
Kortelainen H, Happonen A, Hanski J. From Asset Provider to Knowledge Company—Transformation in the Digital Era. In Lecture Notes in Mechanical Engineering; Springer: Cham, Switzerland, 2019; pp. 333–341. doi:10.1007/978-3-319-95711-1_33.
-
6.
Palacin V, Ginnane S, Ferrario MA, Happonen A, Wolff A, Piutunen S, et al. SENSEI: Harnessing Community Wisdom for Local Environmental Monitoring in Finland. In Proceedings of the CHI Conference on Human Factors in Computing Systems, Glagsgow, UK, 4–9 May 2019; p. 1–8. doi:10.1145/3290607.3299047.
-
7.
Kilpeläinen M, Happonen A. Awareness Adds to Knowledge. Stage of the Art Waste Processing Facilities and Industrial Waste Treatment Development.
Curr. Approaches Sci. Technol. Res. 2021,
4, 125–148. doi:10.9734/bpi/castr/v4/9636D.
[Google Scholar]
-
8.
Vartiainen T, Happonen A, Afonso P, Kärri T. Modeling and Assessing Economical Feasibilities for Waste to Energy Conversion/Incineration Process in Context of Municipal Solid Waste.
Intell. Sustain. Manuf. 2025,
2, 10015. doi:10.70322/ism.2025.10015.
[Google Scholar]
-
9.
Oubrahim I, Sefiani N, Happonen A, Savastano M. Sustainable supply chain performance evaluation: An empirical study using Best Worst Method. In Proceedings of the 2022 International Interdisciplinary Humanitarian Conference for Sustainability (IIHC), Bengaluru, India, 18–19 November 2022; pp. 1184–1190. doi:10.1109/IIHC55949.2022.10059815.
-
10.
Rantala J, Happonen A. Success factors of collaborative product development in production networks. In Proceedings of the 17th International Symposium on Logistics (ISL 2012)—New Horizons in Logistics and Supply Chain Management, Cape Town, South Africa, 8–11 July 2012; pp. 120–127. doi:10.5281/zenodo.3370264.
-
11.
Happonen A, Minashkina D, Nolte A, Medina Angarita MA. Hackathons as a company-University collaboration tool to boost circularity innovations and digitalization enhanced sustainability.
AIP Conf. Proc. 2020,
2233, 050009. doi:10.1063/5.0001883.
[Google Scholar]
-
12.
Ghoreishi M, Happonen A. The Case of Fabric and Textile Industry: The Emerging Role of Digitalization, Internet-of-Things and Industry 4.0 for Circularity.
Lect. Notes Netw. Syst. 2022,
216, 189–200. doi:10.1007/978-981-16-1781-2_18.
[Google Scholar]
-
13.
Santti U, Happonen A, Auvinen H. Digitalization Boosted Recycling: Gamification as an Inspiration for Young Adults to do Enhanced Waste Sorting.
AIP Conf. Proc. 2020,
2233, 050014. doi:10.1063/5.0001547.
[Google Scholar]
-
14.
Salmela E, Santos C, Happonen A. Formalisation of front end innovation in supply network collaboration.
Int. J. Innov. Reg. Dev. 2013,
5, 91–111. doi:10.1504/IJIRD.2013.052510.
[Google Scholar]
-
15.
Sosunova I, Porras J, Wolff A, Happonen A. Towards a Smarter Waste Management: Developing and Evaluating a Smart Waste Management Decision Support Framework.
Int. J. Soc. Ecol. Sustain. Dev. 2024,
15, 1–36. doi:10.4018/IJSESD.361770.
[Google Scholar]
-
16.
Minashkina D, Happonen A. Warehouse Management Systems for Social and Environmental Sustainability: A Systematic Literature Review and Bibliometric Analysis.
Logistics 2023,
7, 40. doi:10.3390/logistics7030040.
[Google Scholar]
-
17.
Tamasiga P, Ouassou EH, Onyeaka H, Bakwena M, Happonen A, Molala M. Forecasting disruptions in global food value chains to tackle food insecurity: The role of AI and big data analytics—A bibliometric and scientometric analysis.
J. Agric. Food Res. 2023,
14, 100819. doi:10.1016/j.jafr.2023.100819.
[Google Scholar]
-
18.
Zaikova A, Deviatkin I, Havukainen J, Horttanainen M, Astrup TF, Saunila M, et al. Factors Influencing Household Waste Separation Behavior: Cases of Russia and Finland.
Recycling 2022,
7, 52. doi:10.3390/recycling7040052.
[Google Scholar]
-
19.
Galán AS, Pérez LT. Global warming impacts on earth: Damage to human health. In Health and Climate Change; Academic Press: Cambridge, MA, USA, 2025; pp. 3–30. doi:10.1016/B978-0-443-29240-8.00028-6.
-
20.
Sivalingam S, Harish A, Selva MR. Environmental and health effects of global warming. In Health and Environmental Effects of Ambient Air Pollution; Academic Press: Cambridge, MA, USA, 2024; pp. 109–129. doi:10.1016/B978-0-443-16088-2.00008-9.
-
21.
Cartwright ED. The hottest year in record and what sea sponge tells us about climate change.
Clim. Energy 2024,
40, 13–19. doi:10.1002/gas.22396.
[Google Scholar]
-
22.
United Nations. 2022. Available online: https://www.un.org/en/global-issues/climate-change (accessed on 2 June 2025).
-
23.
García Alcaraz JL, Díaz Reza JR, Arredondo Soto KC, Escobedo GH, Happonen A, Vidal RPI, et al. Effect of Green Supply Chain Management Practices on Environmental Performance: Case of Mexican Manufacturing Companies.
Mathematics 2022,
10, 1877. doi:10.3390/math10111877.
[Google Scholar]
-
24.
Tereshchenko E, Happonen A, Porras J. Vaithilingam CA. Green Growth, Waste Management, and Environmental Impact Reduction Success Cases From Small and Medium Enterprises Context: A Systematic Mapping Study.
IEEE Access 2023,
11, 56900–56920. doi:10.1109/ACCESS.2023.3271972.
[Google Scholar]
-
25.
Betoniteollisuus ry. Betoni ja ympäristö. 2022. Available online: https://betoni.com/tietoa-betonista/betoni-ja-ymparisto/ (accessed on 3 December 2024).
-
26.
Happonen A, Minashkina D. State of the art preliminary literature review: Sustainability and waste reporting capabilities in management systems.
E3S Web Conf. 2020,
211, 03014. doi:10.1051/e3sconf/202021103014.
[Google Scholar]
-
27.
Zhang C, Han R, Yu B, Wei Y. Accounting process-related CO
2 emissions from global cement production under Shared Socioeconomic Pathways.
J. Clean. Prod. 2018,
184, 451–465. doi:10.1016/j.jclepro.2018.02.284.
[Google Scholar]
-
28.
Cai B, Wang J, He J, Geng Y. Evaluating CO
2 emission performance in China’s cement industry: An enterprise perspective.
Appl. Energy 2016,
166, 191–200. doi:10.1016/j.apenergy.2015.11.006.
[Google Scholar]
-
29.
Du G, Sun C, Ouyang X, Zhang C. A decomposition analysis of energy-related CO
2 emissions in Chinese six high-energy intensive industries.
J. Clean. Prod. 2018,
184, 1102–1112. doi:10.1016/j.jclepro.2018.02.304.
[Google Scholar]
-
30.
Ke J, Zheng N, Fridley D, Price L, Zhou N. Potential energy savings and CO
2 emissions reduction of China’s cement industry.
Energy Policy 2012,
45, 739–751. doi:10.1016/j.enpol.2012.03.036.
[Google Scholar]
-
31.
Imbabi MS, Carrigan C, Mckenna S. Trends and developments in green cement and concrete technology.
Int. J. Sustain. Built Environ. 2013,
1, 194–216. doi:10.1016/j.ijsbe.2013.05.001.
[Google Scholar]
-
32.
Minashkina D, Happonen A. A systematic literature mapping of current academic research linking warehouse management systems to the third-party logistics context.
Acta Logist. 2023,
10, 209–228. doi:10.22306/al.v10i2.377.
[Google Scholar]
-
33.
Minashkina D, Happonen A. A Systematic Literature Mapping of Current Academic Research Connecting Sustainability into the Warehouse Management Systems Context.
Curr. Approaches Sci. Technol. Res. 2021,
5, 52–80. doi:10.9734/bpi/castr/v5/9667D.
[Google Scholar]
-
34.
Minashkina D, Happonen A. Decarbonizing warehousing activities through digitalization and automatization with WMS integration for sustainability supporting operations.
E3S Web Conf. 2020,
158, 03002. doi:10.1051/e3sconf/202015803002.
[Google Scholar]
-
35.
Ganiron TU, Jr. Sustainable Management of Waste Coconut Shells as Aggregates in Concrete Mixture.
J. Eng. Sci. Technol. Rev. 2013,
6, 7–14.
[Google Scholar]
-
36.
Malsang I. Concrete: The World’s 3rd Largest CO2 Emitter. 2021. Available online: https://phys.org/news/2021-10-concrete-world-3rd-largestco2.html (accessed on 23 January 2024).
-
37.
Lehne J, Preston F. Making Concrete Change Innovation in Low-Carbon Cement and Concrete. 2018. Available online: https://www.chathamhouse.org/2018/06/making-concrete-change-innovation-low-carbon-cement-and-concrete (accessed on 4 June 2025).
-
38.
Auvinen H, Santti U, Happonen A. Technologies for Reducing Emissions and Costs in Combined Heat and Power Production.
E3S Web Conf. 2020,
158, 03006. doi:10.1051/e3sconf/202015803006.
[Google Scholar]
-
39.
Happonen A, Siljander V. Gainsharing in logistics outsourcing: trust leads to success in the digital era.
Int. J. Collab. Enterp. 2020,
6, 150–175. doi:10.1504/IJCENT.2020.110221.
[Google Scholar]
-
40.
Rakennusteollisuus RT ry. Suomalaisten betonituotteiden keskimääräiset kasvihuonepäästöt on selvitetty. 2021. Available online: https://www.rakennusteollisuus.fi/Ajankohtaista/Tiedotteet1/2021/suomalaisten-betonituotteiden-keskimaaraisetkasvihuonepaastot-selvitetty/ (accessed on 21 November 2024).
-
41.
Parameswaranpillai J, Pulikkalparambil H, Rangappa SM, Siengchin S. Epoxy Composites; Wiley: Hoboken, NJ, USA, 2021.
-
42.
Kim I-J. Surface engineering for safer walking environments: Optimising floor coatings for enhanced slip resistance.
Results Eng. 2025,
25, 103987. doi:10.1016/j.rineng.2025.103987.
[Google Scholar]
-
43.
Gupta S, Sidhu SS, Chatterjee S, Malviya A, Singh G, Chanda A. Effect of Floor Coatings on Slip-Resistance of Safety Shoes.
Coatings 2022,
12, 1455. doi:10.3390/coatings12101455.
[Google Scholar]
-
44.
Moj M,
Kampa Ł, Czarnecki S. Comparison of machine learning models predicting the pull-off strength of modified epoxy resin floors.
Stud. Geotech. Mech. 2024,
46, 377–388. doi:10.2478/sgem-2024-0024.
[Google Scholar]
-
45.
Zhang J, Zhang Z, Huang R, Tan L. Advances in Toughening Modification Methods for Epoxy Resins: A Comprehensive Review.
Polymers 2025,
17, 1288.
[Google Scholar]
-
46.
Kong A, Kang H, He S, Li N, Wang W. Study on the carbon emissions in the whole construction process of prefabricated floor slab.
Appl. Sci. 2020,
10, 2326. doi:10.3390/app10072326.
[Google Scholar]
-
47.
Happonen A, Ghoreishi M. A mapping study of the current literature on digitalization and industry 4.0 technologies utilization for sustainability and circular economy in textile industries.
Lect. Notes Netw. Syst. 2022,
217, 697–711. doi:10.1007/978-981-16-2102-4_63.
[Google Scholar]
-
48.
Circular Ecology. Embodied Carbon—The Ice Database. 2022. Available online: https://circularecology.com/embodied-carbon-footprint-database.html (accessed on 2 March 2025).
-
49.
The Concrete Centre. Concrete Compass Low Carbon Concrete. 2022. Available online: https://www.concretecentre.com/Resources/ConcreteCompass/Low-Carbon-Concrete.aspx (accessed on 3 November 2023).
-
50.
Hart C. Doing a Literature Review: Releasing the Social Science Research Imagination, 1st ed.; Sage: London, UK, 1999.
-
51.
Levy Y, Ellis TJ. A systems approach to conduct an effective literature review in support of information systems research.
Informing Sci. Int. J. Emerg. Transdiscipl. 2006,
9, 181–212, doi:10.28945/479.
[Google Scholar]
-
52.
Paré G, Trudel MC, Jaana M. Stand-alone literature reviews in information systems research: Development of a taxonomy of review types and assessment of current practices. In Proceedings of the 2012 ASAC Conference-Information Systems Division 2012, St John’s, NL, Canada, 26–29 May 2012.
-
53.
Baumeister R, Leary M. Writing narrative literature reviews.
Rev. Gen. Psychol. 1997,
1, 311–320.
[Google Scholar]
-
54.
Pare MTG. A framework for guiding and evaluating literature reviews.
Commun. Assoc. Inf. Syst. 2015,
37, 112–137.
[Google Scholar]
-
55.
Cronin P, Ryan F, Coughlan M. Undertaking a literature review: A step-by-step approach.
Br. J. Nurs. 2008,
17, 38–43.
[Google Scholar]
-
56.
Wohlin C. Guidelines for snowballing in systematic literature studies and a replication in software engineering. In Proceedings of the 18th International Conference on Evaluation and Assessment in Software Engineerin, London, UK, 13–14 May 2014; pp. 1–10.
-
57.
Hellström J. Life Cycle Assessment of Industrial Floors—A Comparative Study of HTC Superfloor™ and an Epoxy Floor. Master’s thesis, Linköping University, Linköping, Sweden, 2006.
-
58.
Kocí V, Picková E. Life cycle perspective of liquid epoxy resin use in the automotive industry.
Pol. J. Environ. Stud. 2020,
29, 653–667.
[Google Scholar]
-
59.
BIBM—Federation of the European Precast Concrete Industry. Recycling of Epoxy: Challenges and options. 2020. Available online: https://bibm.eu/document-centre/the-little-green-book-ofconcrete-2021/ (accessed on 3 November 2023).
-
60.
Sustainable Concrete. What Is Concrete? 2022. Available online: https://www.sustainableconcrete.org.uk/Sustainable-Concrete/What-is-Concrete.aspx (accessed on 7 April 2024).
-
61.
BIBM—Federation of the European Precast Concrete Industry. The Little Green Book of Concrete. 2021. Available online: https://bibm.eu/document-centre/thelittle-green-book-of-concrete-2021/ (accessed on 27 April 2023).
-
62.
Matthes W, Vollpracht A, Villagrán Y, Kamali-Bernard S, Hooton D, Gruyaert E, et al. Ground granulated blast-furnace slag. Properties of Fresh and Hardened Concrete Containing Supplementary Cementitious Materials: State-of-the-Art Report of the RILEM Technical Committee 238-SCM.
Work. Group 2018,
4, 1–53. doi:10.1007/978-3-319-70606-1_1.
[Google Scholar]
-
63.
Punkki J. Betonin Sideaineet Tulevaisuudessa. 2021. Available online: https://betoni.com/lehti/2021/12/10/betonin-sideaineet-tulevaisuudessa/ (accessed on 8 April 2025).
-
64.
Kaunisto K. Pinnoite lattiatasoitteen päälle—riskit ja mahdollisuudet. 2022. Available online: https://betoni.com/lehti/2022/03/04/pinnoite-lattiatasoitteen-paalle-riskit-ja-mahdollisuudet/ (accessed on 8 April 2025).
-
65.
Betoniteollisuus ry. Betonilattian pinnoitus. 2022. Available online: https://betoni.com/arkkitehtisuunnittelu/arkkitehtisuunnittelu/lattiat/betonilattianpinnoitus/ (accessed on 28 November 2023).
-
66.
Matsinen M. Kulutusrasitetut betonilattiat—kuivasirote vai kovabetoni. 2022. Available online: https://betoni.com/lehti/2022/03/04/kulutusrasitetut-betonilattiat-kuivasirote-vai-kovabetoni/ (accessed on 1 May 2025).
-
67.
Mpa essential materials sustainable solutions. Embodied co2e of uk cement, additions and cementitious material. 2019. Available Online: https://www.concretecentre.com/TCC/media/TCCMediaLibrary/Products/Factsheet_18_2019_updateF.pdf (accessed on 4 June 2025)
-
68.
Circular Ecology. Embodied Carbon Model for Concrete. 2020. Available online: https://circularecology.com/wp-content/uploads/2020/05/EmbodiedCarbon-Calculator-Concrete-Example-Output-Report.pdf (accessed on 16 January 2024).
-
69.
Sustainable Concrete. CO2 Emissions—Production. 2022. Available online: https://www.sustainableconcrete.org.uk/Sustainable-Concrete/PerformanceIndicators/CO2-Emissions-Production.aspx (accessed on 18 March 2024).
-
70.
The Concrete Centre. Embodied Carbon. 2022. Available online: https://www.concretecentre.com/Performance-Sustainability/low-energybuildings/Embodied-carbon.aspx (accessed on 19 April 2024).
-
71.
Kanafani K, Magnes J, Lindhard SM, Balouktsi M. Carbon Emissions during the Building Construction Phase: A Comprehensive Case Study of Construction Sites in Denmark.
Sustainability 2023,
15, 10992. doi:10.3390/su151410992.
[Google Scholar]
-
72.
Ajibike WA, Adeleke AQ, Mohamad F, Bamgbade JA, Moshood TD. The impacts of social responsibility on the environmental sustainability performance of the Malaysian construction industry.
Int. J. Constr. Manag. 2021,
23, 780–789. doi:10.1080/15623599.2021.1929797.
[Google Scholar]
-
73.
Tahir F, Alzahrani S, Noori Y, Al-Ghamdi SG. Environmental impacts and the future prospects of waste utilization in the concrete production. Materials Today: Proceedings, 31 May 2024. doi:10.1016/j.matpr.2024.05.150.
-
74.
Dacić A, Mester-Szabó E, Fenyvesi O, Szalay Z. Life cycle assessment of concrete incorporating all concrete recycling products.
Case Stud. Constr. Mater. 2024,
21, e03910. doi:10.1016/j.cscm.2024.e03910.
[Google Scholar]
-
75.
Olsson JA, Miller SA, Kneifel JD. A review of current practice for life cycle assessment of cement and concrete.
Resour. Conserv. Recycl. 2024,
206, 107619. doi:10.1016/j.resconrec.2024.107619.
[Google Scholar]
-
76.
Barbhuiya S, Kanavaris F, Das BB, Idrees M. Decarbonising cement and concrete production: Strategies, challenges and pathways for sustainable development.
J. Build. Eng. 2024,
86, 108861. doi:10.1016/j.jobe.2024.108861.
[Google Scholar]
-
77.
Fitriani H, Ajayi S. Barriers to sustainable practices in the Indonesian construction industry.
J. Environ. Plan. Manag. 2022,
66, 2028–2050. doi:10.1080/09640568.2022.2057281.
[Google Scholar]
-
78.
Weniger A, Del Rosario P, Backes JG, Traverso M. Consumer Behavior and Sustainability in the Construction Industry-Relevance of Sustainability-Related Criteria in Purchasing Decision.
Buildings 2023,
13, 638. doi:10.3390/buildings13030638.
[Google Scholar]
-
79.
Ahmed AM, Sayed W, Asran A, Nosier I. Identifying barriers to the implementation and development of sustainable construction.
Int. J. Constr. Manag. 2021,
23, 1277–1288. doi:10.1080/15623599.2021.1967577.
[Google Scholar]
-
80.
Akintayo BD, Babatunde OM, Olanrewaju OA. Comparative Analysis of Cement Production Methods Using a Life Cycle Assessment and a Multicriteria Decision-Making Approach.
Sustainability 2024,
16, 484. doi:10.3390/su16020484.
[Google Scholar]
-
81.
Terán-Cuadrado G, Tahir F, Nurdiawati A, Almarshoud MA, Al-Ghamdi SG. Current and potential materials for the low-carbon cement production: Life cycle assessment perspective.
J. Build. Eng. 2024,
96, 110528. doi:10.1016/j.jobe.2024.110528.
[Google Scholar]
-
82.
Dong Y, Ng ST, Liu P. Towards the principles of life cycle sustainability assessment: An integrative review for the construction and building industry.
Sustain. Cities Soc. 2023,
95, 104604. doi:10.1016/j.scs.2023.104604.
[Google Scholar]
-
83.
Chen L, Huang L, Hua J, Chen Z, Wei L, Osman AI, et al. Green construction for low-carbon cities: a review.
Environ. Chem. Lett. 2023,
21, 1627–1657. doi:10.1007/s10311-022-01544-4.
[Google Scholar]
-
84.
Clarke LA, Cope RJ. Concrete Slabs: Analysis and Design; CRC Press: Boca Raton, FL, USA, 1984; p. 524. doi:10.1201/9781482292794.
-
85.
Kandasamy A. Comparative Analysis on Load-deformation Behavior of RC Slabs Incorporating Nano-SiO₂ and Coconut Fibers.
J. Environ. Nanotechnol. 2025,
14, 18–29. doi:10.13074/jent.2025.03.2511233.
[Google Scholar]
-
86.
Josa I, Monserrat-López A, Bianchi S, Ciurlanti J, D’Amore S, Pampanin S, et al. Sustainability model for precast concrete buildings. Case study: Commercial building in Reggio Calabria (Italy).
Struct. Concr. 2025. doi:10.1002/suco.70061.
[Google Scholar]
-
87.
Qi J, Yang H-C. Improvement of a Truss-Reinforced, Half-Concrete Slab Floor System for Construction Sustainability.
Sustainability 2021,
13, 3731. doi:10.3390/su13073731.
[Google Scholar]
-
88.
Abbass W, Kashif MH, Ahmed M, Aslam F, Ahmed A, Mohamed A. Enhancing durability and sustainability of industrial floors: A comparative analysis of dry-shake surface hardeners.
Heliyon 2024,
10, e31830. doi:10.1016/j.heliyon.2024.e31830.
[Google Scholar]
-
89.
Minde P, Kulkarni M, Patil J, Shelake A. Comprehensive review on the use of plastic waste in sustainable concrete construction.
Discov. Mater. 2024,
4, 58. doi:10.1007/s43939-024-00126-1.
[Google Scholar]
-
90.
Rajadesingu S, Mendonce KC, Palani N, Monisha P, Vijayakumar P, Ayyadurai S. Exploring the potential of bacterial concrete: A sustainable solution for remediation of crack and durability enhancement–A critical review.
Constr. Build. Mater. 2024,
439, 137238. doi:10.1016/j.conbuildmat.2024.137238.
[Google Scholar]
-
91.
Golafshani EM, Kim T, Behnood A, Ngo T, Kashani A. Sustainable mix design of recycled aggregate concrete using artificial intelligence.
J. Clean. Prod. 2024,
442, 140994. doi:10.1016/j.jclepro.2024.140994.
[Google Scholar]
-
92.
Waqar A, Khan MB, Najeh T, Almujibah HR, Benjeddou O. Performance-based engineering: formulating sustainable concrete with sawdust and steel fiber for superior mechanical properties.
Front. Mater. 2024,
11, 1428700. doi:10.3389/fmats.2024.1428700.
[Google Scholar]
-
93.
Kortelainen H, Happonen A, Kinnunen S-K. Fleet Service Generation—Challenges in Corporate Asset Management, Lecture Notes in Mechanical Engineering; Springer: London, UK, 2016; pp. 373–380. doi:10.1007/978-3-319-27064-7_35.
-
94.
Kinnunen S-K, Happonen A, Marttonen-Arola S, Kärri T. Traditional and extended fleets in literature and practice: Definition and untapped potential.
Int. J. Strateg. Eng. Asset Manag. 2019,
3, 239–261. doi:10.1504/IJSEAM.2019.108467.
[Google Scholar]
-
95.
Abdelsalam A, Happonen A, Kärhä K, Kapitonov A, Porras J. Toward Autonomous Vehicles and Machinery in Mill Yards of the Forest Industry: Technologies and Proposals for Autonomous Vehicle Operations.
IEEE Access 2022,
10, 88234–88250. doi:10.1109/ACCESS.2022.3199691.
[Google Scholar]
-
96.
Usmani UA, Happonen A, Watada J. Human-Centered Artificial Intelligence: Designing for User Empowerment and Ethical Considerations. In Proceedings of the 2023 5th International Congress on Human-Computer Interaction, Optimization and Robotic Applications (HORA), Istanbul, Turkey, 8–10 June 2023; pp. 1–7, doi: 10.1109/HORA58378.2023.10156761.
-
97.
Ghoreishi M, Happonen A. New promises AI brings into circular economy accelerated product design: a review on supporting literature.
E3S Web Conf. 2020,
158, 06002. doi:10.1051/e3sconf/202015806002.
[Google Scholar]
-
98.
Ghoreishi M, Happonen A. Key enablers for deploying artificial intelligence for circular economy embracing sustainable product design: Three case studies.
AIP Conf. Proc. 2020,
2233, 050008. doi:10.1063/5.0001339.
[Google Scholar]