1. Introduction
Patients born with single ventricle heart disease (SVD), a severe and rare congenital heart defect (CHD), are subjected to three palliative surgeries that culminate in the Fontan circulation [
1]. While staged palliation addresses the primary concerns of obstructed systemic blood flow and cyanosis in a condition like hypoplastic left heart syndrome, a range of Fontan-associated comorbidities are often apparent in adolescence [
2]. Morbidity and mortality after Fontan surgery remain unacceptably high [
2], and new approaches to predict patient decline are sorely needed. Our goal is to develop a new prognostic model for SVD patients and explore machine learning (ML) methods as a tool of risk stratification in the Fontan population.
Principal component analysis (PCA) is a data reduction technique that is often applied to large data sets in research [
3,
4,
5,
6,
7], although it has not yet been applied to the Fontan population outside of waveform analysis [
8,
9]. Scientists have used PCA to identify patterns of inflammatory and adhesion molecules that contribute to muscle weakness acquired in the intensive care unit [
4], or to identify inflammatory markers of major adverse cardiovascular events following heart attack at one year compared to univariate cytokine measures [
6]. These studies support our hypothesis that a PCA approach may enhance outcomes prediction in heterogenous disease states like the Fontan population, where a large number of potential predictor variables exist that stem from many testing domains.
We have previously applied PCA to characterize cavopulmonary flow waveforms [
8,
9]; here we expand that approach to include heterogenous biomarkers. Our primary objective in this study was to assess our previously defined novel waveform measures and other clinical parameters in a heterogenous PCA approach, all in support of the overall hypothesis that machine-learning extracted PCs will delineate patients with Fontan-associated comorbidities and reveal parameters that indicate circulatory failure in patients with a Fontan circulation. More specifically, a machine-learning extracted PC, which will consist of a pattern of abnormalities in multiple cardiac and non-cardiac test results, previously unrecognized as an important predictor of outcomes, will be associated with a composite outcome of Fontan failure.
2. Materials and Methods
One-hundred and forty SVD patients who underwent cardiac MRI (cMRI) at Children’s Hospital Colorado between July 2011 and August 2022 were included in this retrospective cohort study, permitted by the Colorado Multiple Institutional Review Board (COMIRB) as a portion of Fontan at Altitude Registry for Outcomes under waiver of consent. All research was guided by the principles of respect for persons, beneficence, and justice set forth in the Ethical Principles and Guidelines for the Protection of Human Subjects of Research (often referred to as the Belmont Report). All patients cared for in the Fontan Multidisciplinary Clinic at the Children’s Hospital Colorado have undergone surveillance testing for end-organ damage and Fontan-associated comorbidities by way of a clinical practice guideline since 2016 and were included. The registry was queried, and abstracted data (
) were used as a foundation for a study database, in addition to our single site venous flow patterns [
10]. For the purposes of survival analysis, study subject status was evaluated as of 1 December 2022, and a composite outcome was defined as the development of plastic bronchitis (PB,
n = 1), protein-losing enteropathy (PLE,
n = 2), referral to transplant (RTT,
n = 9), received a transplant (
n = 4), or death (
n = 0) from the time of cMRI to time to follow up. Imaging and biomarkers were collected concurrently, and catheterization values were collected within one month of time of the other measurements.
.
Measures used in heterogenous PCA, including novel single vessel waveform data, hemodynamic, global cardiovascular, blood, kidney, liver, and respiratory biomarkers, and their mean or median and corresponding standard deviation or interquartile range.
| Measure |
Mean or Median |
St. Dev or IQR |
| SVC Single PC1 Scores |
−0.522 |
−2.87–3.12 |
| SVC Single PC2 Scores |
−0.478 |
−0.870–0.0638 |
| IVC Single PC1 Scores |
−0.172 |
−3.21–3.69 |
| IVC Single PC2 Scores |
0.21 |
−1.53–1.35 |
| LPA Single PC1 Score |
0.397 |
−3.01–2.07 |
| LPA Single PC2 Score |
0.181 |
−0.656–1.24 |
| EF |
47.9 |
8.11 |
| EDVi |
93.3 |
27 |
| ESVi |
49.8 |
20.5 |
| SVi |
43.5 |
10.4 |
| CO |
4.43 |
1.43 |
| CI |
3.41 |
1.04 |
| BSA |
1.32 |
0.415 |
| BNP max |
30 |
15–61.8 |
| AST |
45 |
38–57 |
| VVCR |
0.963 |
0.3 |
| Lowest SaO2 |
86.4 |
5.56 |
| SVC Mean |
13 |
11–14 |
| mPAP |
12 |
10–13 |
| Alb |
4.54 |
0.685 |
| Platelets |
197 |
65.2 |
| Alk Phos |
158 |
80.3 |
| Total Protein |
7.53 |
1.1 |
| Creatinine |
0.61 |
0.49–0.763 |
| BUN |
14 |
12–17 |
| Cystatin C |
0.86 |
0.755–0.96 |
2.1. cMRI Acquisition
Phase images and corresponding magnitude images of the superior vena cava (SVC), inferior vena cava (IVC), and left pulmonary artery (LPA) were obtained using a previously described ECG gated PC-MRI sequence [
11,
12] and a phased-array body surface coil within 1.5 or 3.0 Tesla Ingenia (Philips Medical System, Best, The Netherlands) or Magnetom Avanto (Siemens Medical Solutions, Erlangen, Germany) systems. The PC-MRI sequence was free breathing as described in our previous works [
8,
9].
Flow Profile Analysis
Flow profile characteristics were assessed as described previously with slight modifications [
9]. Individual patient flow waveforms were captured at the SVC, IVC, and LPA from 2D phase-contrast image series using precise parallel segmentation in Circle CVi42 (Calgary, AB, Canada). The resulting text data files were imported into MATLAB (Natick, MA, USA) for further analysis. Waveforms were normalized by dividing all flow points by patient BSA to reduce the size effect on the flow magnitude, and were then interpolated to 40 points with cubic splines to ensure equal-sized array lengths. Three data matrices were created containing single-site flow data; the size of each such matrix depended on the number of acquired image series and is as follows: SVC (124 × 40), IVC (132 × 40), and LPA (125 × 40).
2.2. Clinical Biomarkers
Global cardiovascular and ventricular indicators (EF, CO, CI, EDVi, ESVi, SVi) have long been established as the benchmark for Fontan patient status [
8,
13,
14,
15] and therefore were included in the analysis for validation purposes. VVCR, mean catheterization pressures (mPAP and SVC mean pressure), VO
2max, BNPmax and O
2 saturations were also included in the outcomes analysis, all of which have been independently linked to Fontan circulation health and outcomes [
16,
17,
18,
19]. We have previously determined that biomarkers indicative of lymphatic function and PLE, specifically aspartate aminotransferase, alkaline phosphatase, cystatin-c and creatinine, were associated with caval flow patterns [
9], strongly indicating that these parameters may identify, or be predictive of, which Fontan patients will experience circulatory failure. Similarly, biomarkers such as albumin, total protein, blood urea nitrogen and platelet count were included due to previous reports relating these to Fontan patient cyanosis and pulmonary blood flow [
20,
21].
2.3. Principal Component Analysis
PCA requires that the input data matrix has a value assigned to each position. Therefore, after the exported registry was read into MATLAB, patients with more than five measures missing were removed from the analysis. This was done in an effort to maintain a missing data rate of less than 5% [
22], and the resulting clinical parameters and demographic information can be found in
. Patients that had missing values less than or equal to five were replaced with the column median, as a value is required for each position in the input matrix. Columns were normalized, and the resulting matrix was the input for PCA. Scree plots were created to determine PCs representing greater than 5% of total variance. Interpretation of which clinical parameters had the greatest influence on each PC was graphically determined by visualizing PC eigenvectors.
2.4. Statistics
GraphPad Prism 9.5.1 (Boston, MA, USA) was used for all statistical analyses. Analysis began with computing the univariate Cox hazard ratio (HR) for PCs 1–10 and EF, a measure of systolic function that serves as a benchmark diagnostic for patients with a Fontan circulation [
23]. Akaike’s information criterion (AIC) and the c-statistic were also gathered, and receiver operating characteristic (ROC) curves, area under the curve (AUC), as well as Youden’s index, defined as (sensitivity(x) − specificity(x)) − 1, were computed for measures with the greatest c-statistic. The optimum sensitivity, specificity and clinical threshold for grouping was found and used to define groups for Kaplan-Meier survival analysis. Significant differences between Kaplan-Meier curves were determined with the Mantel-Cox log-rank test. Parameters were selected (up to two parameters at a time) for multivariate (bivariate) regression analysis from univariate analyses of said parameters with the greatest c-statistics, and univariate and multivariate predictive models were compared using AIC.
3. Results
3.1. Principal Component Analysis
The original data matrix was 140 × 31 and was reduced to 115 × 31 after the removal of patients missing more than five measures. The remaining matrix had a 4.15% rate of missing data, and therefore fell within the 5% acceptable rate [
22]. Columns of the matrix included scores for single site SVC, IVC, and LPA flow patterns, each representing a patient’s contribution to that PC’s waveform pattern, EF, EDVi, ESVi, SVi, CO, CI, BSA, BNP max, AST, VVCR, lowest SaO
2, SVC mean pressure, mPAP, albumin, platelets, alkaline phosphatase, total protein, creatinine, BUN, and cystatin-C (
).
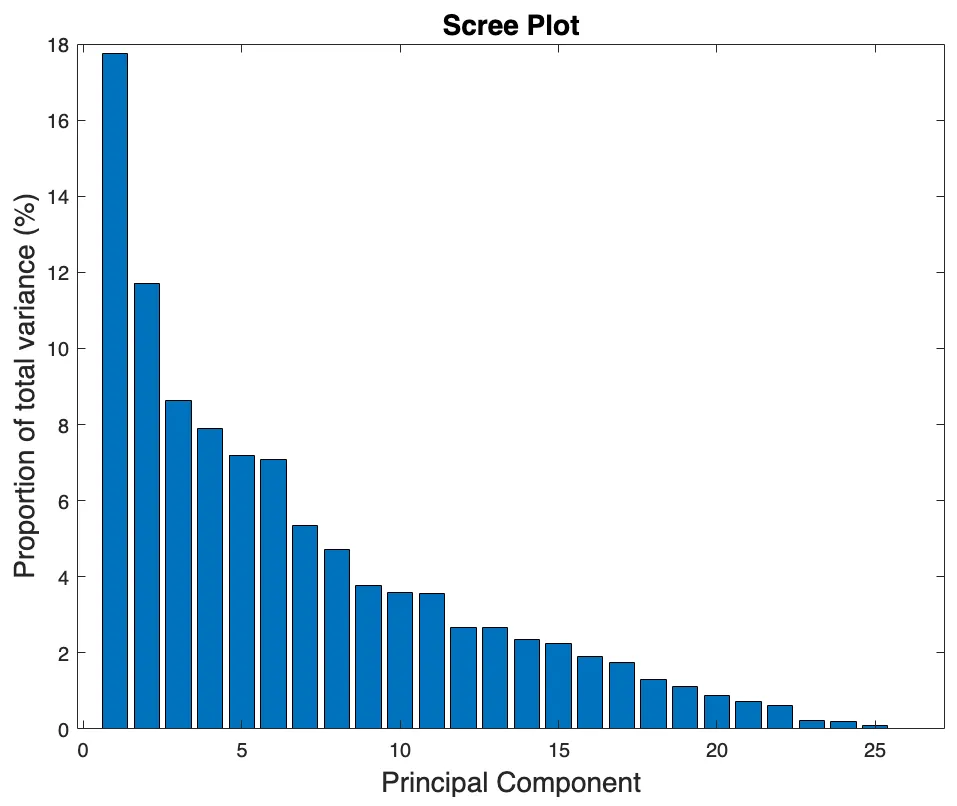
Following PCA, a scree plot was used to identify the percentage each PC contributed to the overall variance in the original data set and can be seen in
. The first PC accounted for about 17.5% of the original data matrix variance, followed by approximately 11.5% for PC2, 8.5% for PC3, and subsequently decreased as the PC number increased (
). Each of the first 7 PCs accounted for more than 5% of the total variance and together explained 70.3% of that variance; PCs up to PC10 (3.6% of total variance, 77.7% cumulative variance) were considered for survival analysis.
. The scree plot displays each PC (<i>x</i>-axis) and the percent variance it represents in the original data set (<i>y</i>-axis).
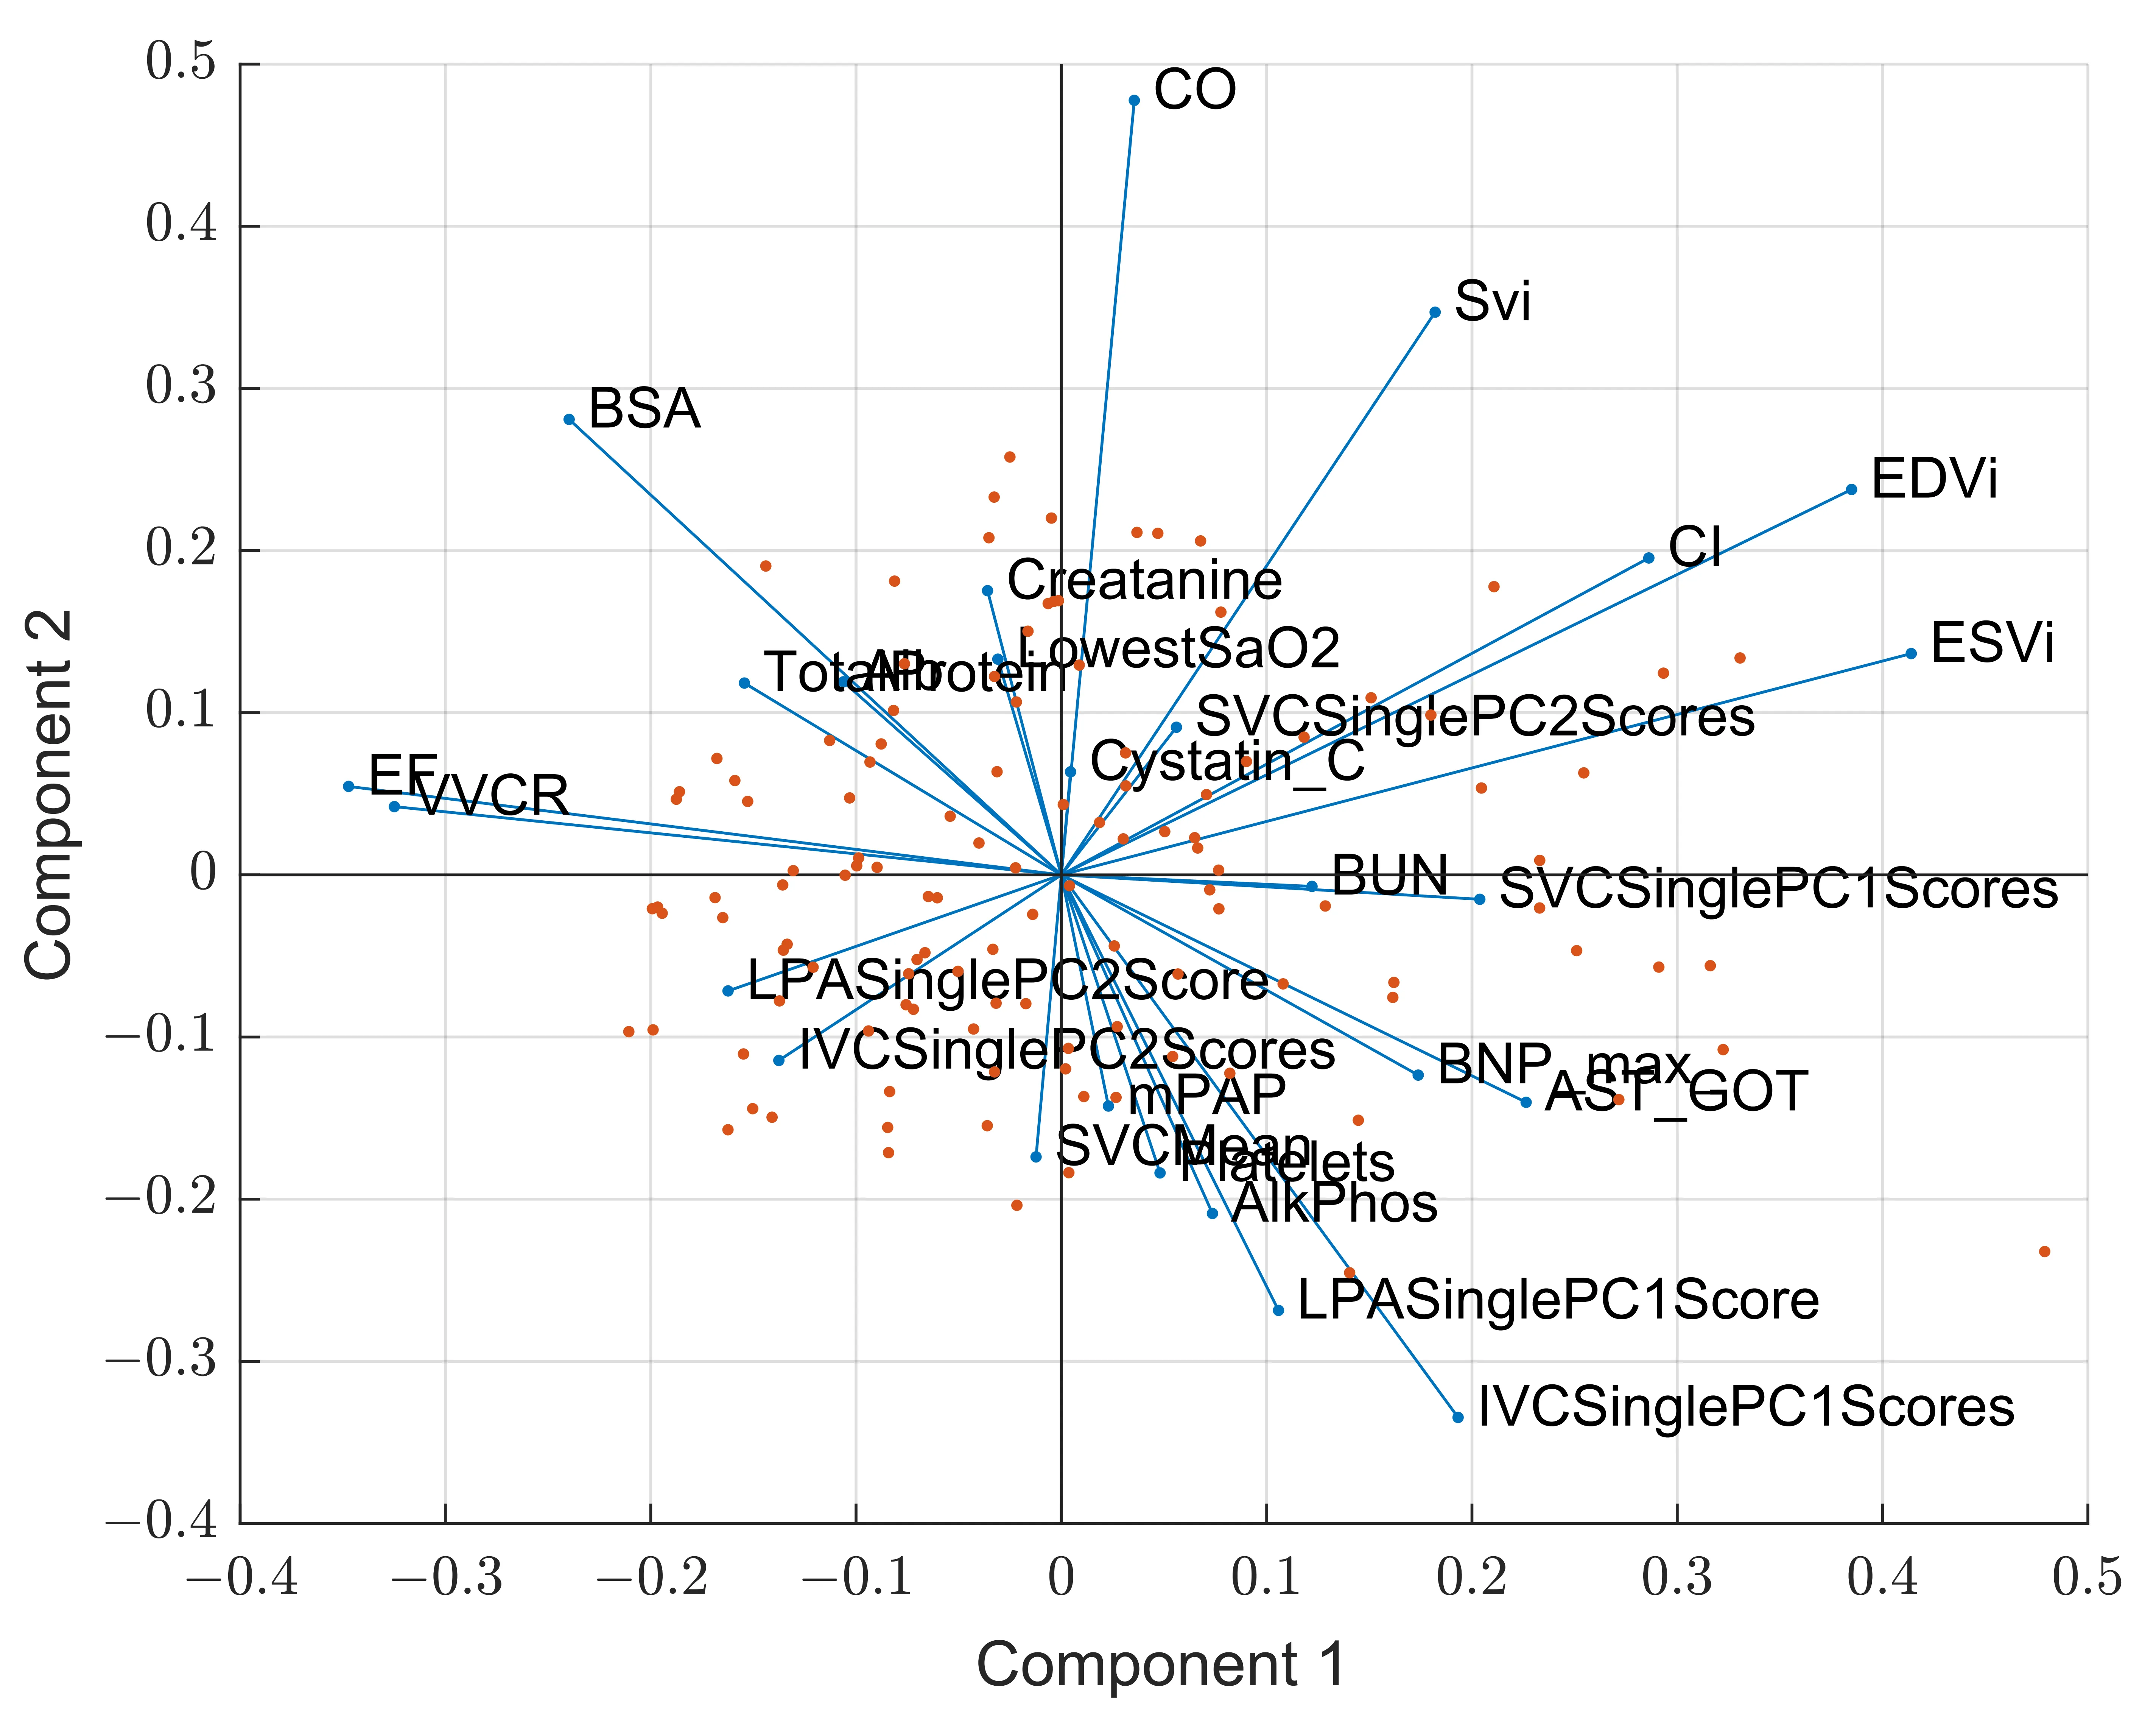
Interpretation of the first two PCs was aided by the biplot displayed in
, where the blue lines represent the eigenvectors, or PC coefficients, and the length and direction represent that parameter’s influence on each PC. For example, further distance from the origin on the
x-axis means greater contribution to PC1, therefore EDVi, ESVi, EF, and VVCR contributed the most to PC1 (
). PC2 variance is explained by deviance from zero along the
y-axis, and major influencing parameters include CO, SVi, LPA PC1 and IVC PC1 (
). The red data points represent the scores, or how each patient sample contributes to the PCs.
. Principal component biplot that displays the scores returned from PCA, or each sample, in the original dimension and are represented by the red data points. The eigenvectors, or the coefficients, for each clinical parameter are displayed as the blue lines, and the direction and length represent the influence each parameter has on PC1 (<i>x</i>-axis) and PC2 (<i>y</i>-axis).
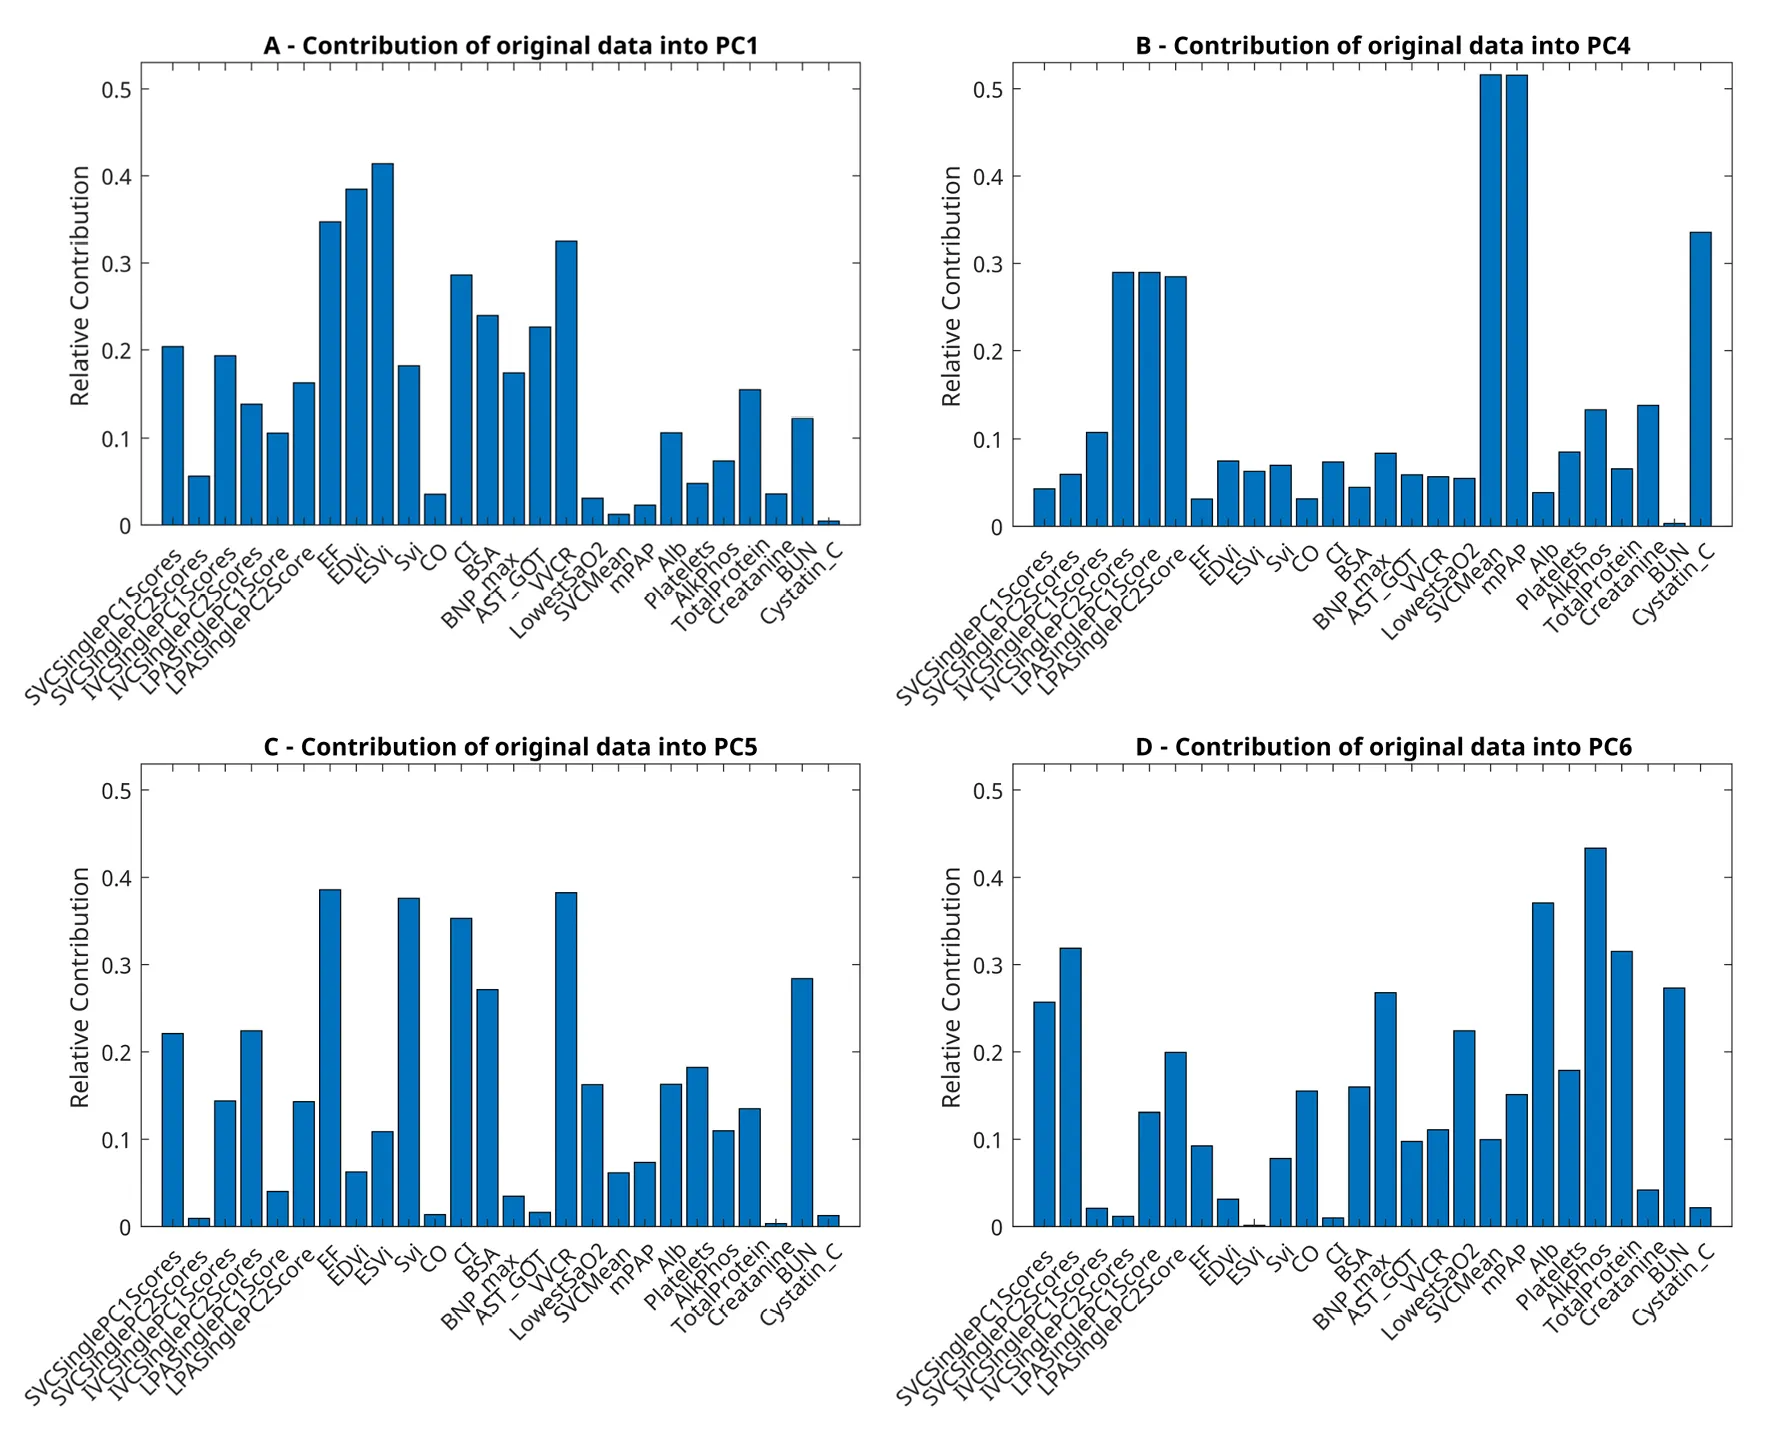
The clinical implications of each PC were examined using bar graphs of the PC eigenvectors, where the clinical parameters (
x-axis) and their relative contributions to each PC (
y-axis) are displayed in
. The first PC was highly influenced by cardiac parameters, including EF, EDVi, ESVi, CI, VVCR, AST, SVC PC1 Scores, and IVC PC1 scores, which primarily describe cardiac function and the downstream effects in the Fontan circulation. The fourth PC was highly influenced by IVC and LPA waveform patterns in addition to cavopulmonary pressures and cystatin-C. PC5 was influenced by cardiac parameters representative of systolic function, such as EF, SVi, CI, and VVCR, and waveform patterns IVC PC2, SVC PC1 scores, and BUN. Albumin, alkaline phosphatase, total protein, BUN, BNP max, and SVC waveforms scores influenced PC 6.
. Bar graphs for (<b>A</b>) PC1, (<b>B</b>) PC4, (<b>C</b>) PC5 and (<b>D</b>) PC6 display each clinical parameter considered in PCA, or the column headers, and the amount (<i>y</i>-axis, 0 up to 1) that parameter influences each PC.
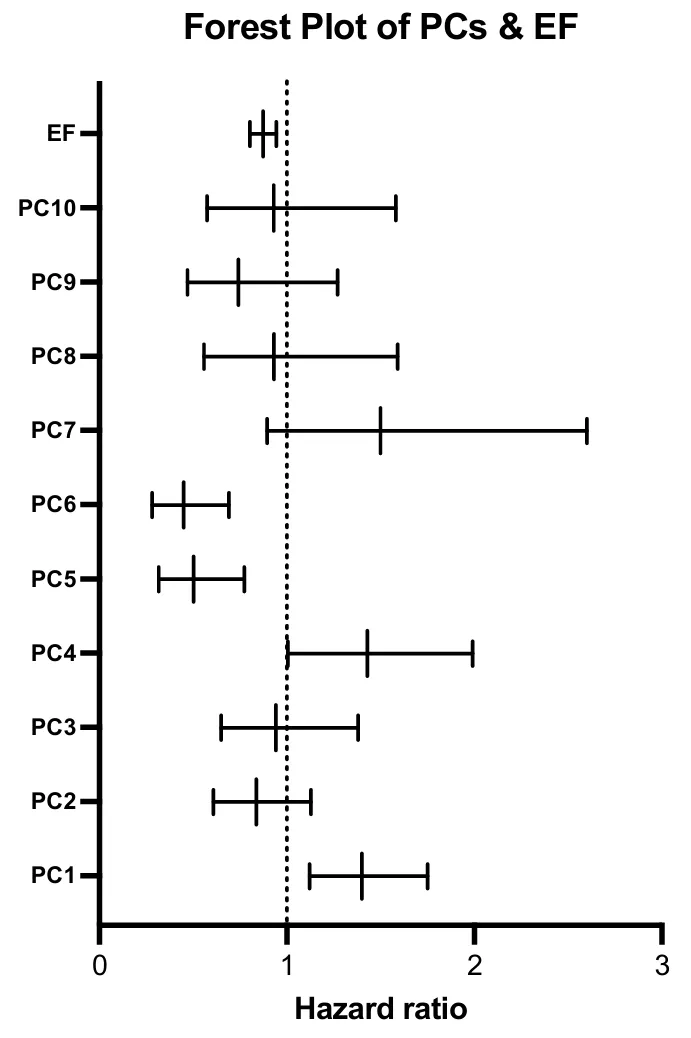
Univariate Cox proportional hazard ratio was determined for each PC and can be found in
. The single best predictor of which patient is at a greater hazard is PC6 (AIC = 109), followed by the standard measure used for prediction in this population, EF (AIC = 111) (
). PC1 and PC5 also performed well, with AICs of 113 and 115. The hazard ratio for EF and each PC is displayed in a forest plot in
, and the bars represent the 95% confidence intervals. If a parameter’s confidence interval crossed one, it was not statistically significant (
).
.
Univariate cox regression hazard ratio for each PC and EF.
| Variable |
HR |
95% CI |
p-Value |
c Stat |
Variable |
| PC1 |
1.40 |
1.12 to 1.75 |
0.00280 |
0.705 |
PC1 |
| PC2 |
0.836 |
0.607 to 1.13 |
0.254 |
0.555 |
PC2 |
| PC3 |
0.941 |
0.649 to 1.38 |
0.753 |
0.453 |
PC3 |
| PC4 |
1.43 |
1.00 to 1.99 |
0.0404 |
0.619 |
PC4 |
| PC5 |
0.502 |
0.315 to 0.773 |
0.00250 |
0.718 |
PC5 |
| PC6 |
0.449 |
0.280 to 0.691 |
0.000500 |
0.759 |
PC6 |
| PC7 |
1.50 |
0.894 to 2.60 |
0.140 |
0.617 |
PC7 |
| PC8 |
0.931 |
0.558 to 1.59 |
0.793 |
0.587 |
PC8 |
| PC9 |
0.741 |
0.469 to 1.27 |
0.242 |
0.539 |
PC9 |
| PC10 |
0.929 |
0.574 to 1.58 |
0.777 |
0.519 |
PC10 |
| EF |
0.873 |
0.803 to 0.944 |
0.000900 |
0.726 |
EF |
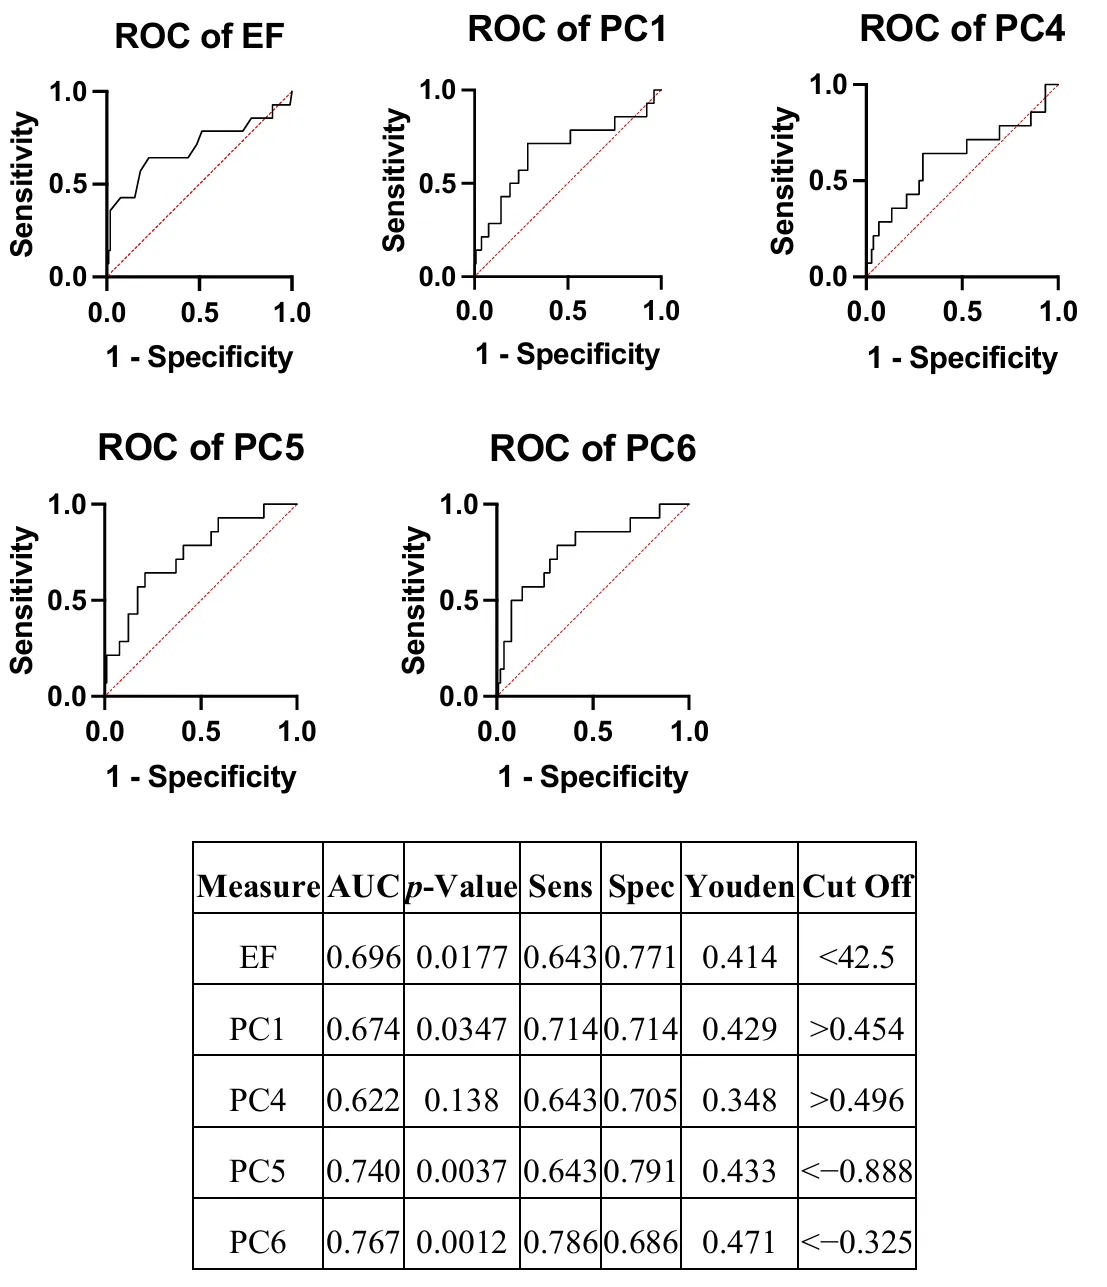
Parameters with the greatest c-statistics were tested as classifiers of patients with Fontan decline using ROC curves, and PC6 returned the greatest AUC at 0.767, followed by PC5 (AUC = 0.740), and EF (AUC = 0.696) (
). The accompanying optimum sensitivity and specificity, determined using the greatest distance from the null hypothesis line or Youden’s index, was also found and shows that, while EF is highly specific (0.771) and therefore able to designate patients with Fontan failure correctly (low EF is almost always accompanied by SVD circulatory failure), its sensitivity is lacking at 0.643 (
). Sensitivity determines a classifier’s ability to label patients without Fontan decline correctly, and all PCs had the same, if not superior, sensitivity compared to EF (
). PC6 had the greatest sensitivity (0.786) with a reasonably balanced specificity at 0.686, suggesting it can rule healthy Fontan patients out as having circulatory failure, and PC1 had both optimum sensitivity and specificity at 0.714 (
). PC6 also displayed the greatest maximum effective biomarker, represented by Youden’s index of 0.471 (
).
. The forest plot displays the hazard ratio for each PC and EF and the corresponding 95% confidence intervals. Bars that cross 1, or the null hypothesis, represents no difference in hazards between patients that experienced an event versus those that did not.
. ROC curves for each PC that returned the greatest c-statistics and EF and the accompanying AUC, <i>p</i>-value, optimum sensitivity and specificity and the corresponding clinical cut off.
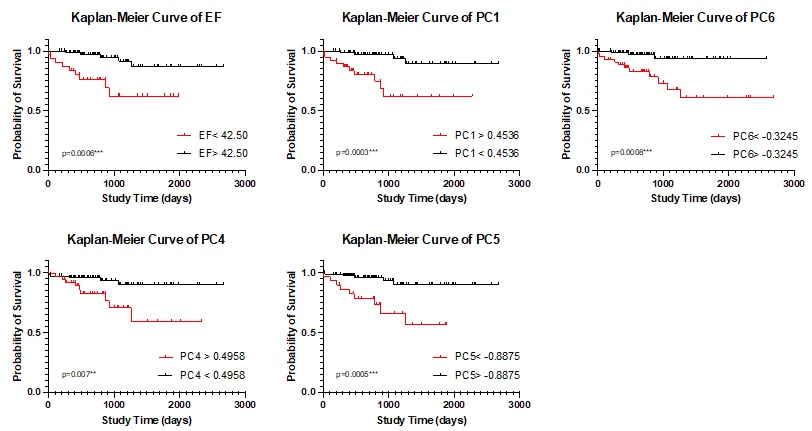
Grouping patients based on Youden’s index allows for Kaplan-Meier curve generation, displayed in
. Though EF was determined to have statistically significant differences in survival using the Mantel Cox log rank test (
p = 0.0006), PC1 and PC5 performed better with
p-values of 0.0003 and 0.0005 (
). PC6 also had highly significant differences in survival (
p = 0.0008), though it was not as significant as EF, and PC4 also displayed a significant difference in survival (
p = 0.007) (
).
. Kaplan-Meier curves for each PC that returned the greatest c-statistics and EF, and the <i>p</i>-value returned from the log-rank Mantel Cox <i>p</i>-value. Groups were created using the Youden’s index defined cut-off values. <sup>∗∗</sup> <i>p</i> < 0.01, <sup>∗∗∗</sup> <i>p</i> < 0.001.
The inputs for multivariate Cox hazard regression analysis were EF, ESVi, and PC1 and PCs 4–6 and were chosen based on their univariate c-statistics. The models developed and each covariate’s HR estimate, 95% CI,
p-value, c-statistic, and AIC are listed in
. The greatest AIC, and therefore predictive model, was model B (0.807, AIC = 97) and included EF and PC6. However, model F, consisting of PC5 and PC6, has a greater c-statistic (0.845, AIC = 103) and therefore is more probable to randomly identify a patient who experienced an event as having a greater risk score than a patient who did not experience an event.
.
Multivariate models were developed, up to two measures at a time, for each PC and systolic measures EF and ESVi, the corresponding HR estimates, 95% CIs, p-values, c-statistic and AIC (used for model selection).
|
Covariates |
HR Estimate |
95% CI |
p-Value |
c Stat. |
AIC |
| A |
EF |
0.906 |
0.804 to 1.02 |
0.101 |
0.726 |
112 |
| ESVi |
1.02 |
0.979 to 1.06 |
0.413 |
| B |
PC6 |
0.455 |
0.287 to 0.682 |
0.0003 |
0.807 |
97 |
| EF |
0.875 |
0.811 to 0.939 |
0.0003 |
| C |
PC5 |
0.667 |
0.402 to 1.04 |
0.0931 |
0.738 |
110 |
| EF |
0.901 |
0.822 to 0.988 |
0.0247 |
| D |
PC4 |
1.37 |
0.960 to 1.93 |
0.0765 |
0.756 |
110 |
| EF |
0.884 |
0.814 to 0.952 |
0.0019 |
| E |
PC1 |
1.11 |
0.802 to 1.52 |
0.505 |
0.734 |
112 |
| EF |
0.895 |
0.802 to 0.994 |
0.0413 |
| F |
PC5 |
0.574 |
0.372 to 0.841 |
0.0071 |
0.845 |
103 |
| PC6 |
0.461 |
0.279 to 0.721 |
0.0012 |
| G |
PC4 |
1.395 |
0.982 to 1.95 |
0.0558 |
0.803 |
108 |
| PC6 |
0.445 |
0.271 to 0.695 |
0.0007 |
| H |
PC4 |
1.448 |
1.01 to 2.06 |
0.0426 |
0.764 |
111 |
| PC5 |
0.501 |
0.313 to 0.771 |
0.0024 |
| I |
PC1 |
1.322 |
1.06 to 1.65 |
0.0123 |
0.799 |
105 |
| PC6 |
0.516 |
0.327 to 0.766 |
0.0022 |
| J |
PC1 |
1.595 |
1.22 to 2.11 |
0.0006 |
0.784 |
103 |
| PC5 |
0.482 |
0.313 to 0.717 |
0.0005 |
| K |
PC1 |
1.404 |
1.12 to 1.75 |
0.0028 |
0.781 |
113 |
| PC4 |
1.462 |
1.01 to 2.10 |
0.0425 |
4. Discussion
Herein, we explored univariate and multivariate associations between standard and/or ML-derived parameters and composite outcomes in a large, single-center Fontan cohort through use of heterogeneous feature reduction (PCA). We determined PCs that appear to relate to specific features of Fontan decline, and that these features were significant univariate and multivariate predictors of a composite event. The incorporation of novel biomarkers representing combined lymphatic, blood, exercise, and cardiovascular measurements significantly improved the mathematical prediction of decline in the Fontan population. These biomarkers have the potential to improve Fontan patient outcomes by providing early indicators of cardiovascular decline, allowing for improved patient specific care strategies and preemptive intervention.
PC6 was identified as a highly significant measure of hazard in our cohort and was the greatest univariate predictor of outcomes with an AIC of 109. The parameters that contributed most to this principal component—albumin, alkaline phosphatase, total protein, BUN, and BNP max—have also been linked to the development of lymphatic dysfunction, particularly protein-losing enteropathy (PLE), in the Fontan population [
23,
24,
25]. Cavopulmonary flow patterns also influence PC6 and have previously been suspected as contributors to PLE [
23]; thus, this supports our understanding of PLE development and poorer prognosis in the Fontan population, especially given that PC6 was also the most accurate classifier. It is also worth noting that only two patients (of 16) experienced a composite outcome of PLE. Additionally, with a sensitivity of 78.6% and specificity of 68.6%, this PC may be clinically useful in categorizing (or risk stratifying) patients. For example, after undergoing surveillance testing for end-organ damage and Fontan-related comorbidities, a patient could have their CMR-derived flow waveforms and other biomarkers examined here projected into a known feature set (heterogeneous PCs), after which these latter PCs would be used to classify the patient as either at-risk or not, based on the present analysis. Additional work, in terms of data collection and validation, as well as potentially longitudinal studies targeting causality, must be performed to identify the role parameters represented by PC6 plays in the development of PLE, though this study provides a promising foundation for further research.
Survival was significantly predicted by all PCs identified as having a significant hazard ratio (1, 4, 5, 6), though two performed superior to EF, the standard measure of health and cardiac function in this population. PC1 performed better at prediction than EF alone and represented components of general cardiac function, including EF, EDVi, ESVi, VVCR, CI, and cavopulmonary flow measures. Our findings support that PCA is a useful method for the inclusion of colinear parameters [
5], and inclusion of such measures does in fact improve prediction of outcomes better than a single measure of ventricular function or multivariate testing. PC5 also improved prediction of outcomes compared to EF and was influenced by EF, SVi, CI, BSA, VVCR, BUN, SVC and LPA waveform patterns, most of which are affected by systolic ventricular function. However, little improvement was noted in a multivariate model that included EF and PC1 (AIC = 112) and EF and PC5 (AIC = 110) compared to the individual parameter’s AIC scores [EF (111), PC1 (115), and PC5 (109)] which may be due to redundant information (
i.e., EF, and thus, systolic function, is now accounted for twice in the model). These results support the hypothesis that machine-learning extracted PCs clearly delineate SVD patients with Fontan-associated comorbidities from those without, in addition to our previously published hypothesis that a multivariable approach, in this case PCA, improves prediction of this heterogenous patient population with multiple organ systems in various stages of failure [
9].
The best predictive model explored in this study, determined by AIC, is the multivariate Cox regression model B (
), including covariates EF and PC6. If PC6 is in fact linked to PLE, our findings suggest a combination of systolic ventricular function and measures indicative of lymphatic dysfunction may be an avenue for improved prognostication. This model, however, did not have the greatest c-statistic, which suggests it may not be suitable for ranking patients according to risk. Model F, including covariates PC5 and PC6, had the greatest c-statistic and is most suitable in determining which patients are at a higher risk.
The limitations of this study, as previously described [
8], include those inherent to PCA. Linear data reduction does not consider non-linear data relationships and is accompanied by a loss of, ideally insignificant, original data variance. Additionally, several patients were removed from analysis because PCA requires that the input matrix have no missing data, and imputation was performed. The cohort may contain a selection bias, because not all of our Fontan patients received a routine CMR examination in the past. Finally, ML thrives on large datasets, and while our final set (
n = 115) is large for a pediatric population, the even numbers are low for PB and PLE, and clearly multicenter studies or learning networks will offer even greater insights into disease progression. Despite limitations, this work has established that a heterogenous approach to PCA is beneficial to outcomes prediction in Fontan patients, and that our novel single site venous waveform patterns contribute to PCs predictive of decline.
5. Conclusions
The goal of this study was to determine if a heterogenous PCA approach applied to the Fontan cohort can predict functional decline. Our main findings suggest that PC6, which is primarily influenced by blood serum biomarkers and SVC flow and represents roughly 7% of the overall variance, is superior to EF as a measure of proportional hazard in this population. We also found that Fontan patients were most accurately classified by PC6, as determined by AUC, and we identified two additional PCs that indeed predicted survival in this population better than EF. Our findings support our suspicions that improved prognostication in a Fontan population should utilize a multifactorial model.
Acknowledgments
This research was supported by the Jayden DeLuca Foundation, NIH CTSA Grant UL1 TR002535, and the American Heart Association Children’s Heart Foundation Predoctoral Congenital Heart Defect Research Award 20PRE35260057 to MRF. The authors would like to additionally thank Dunbar Ivy for his support of the dissertation work that led to this manuscript.
Author Contributions
M.R.F. and K.S.H. developed the main ideas for the manuscript; M.S. and M.V.D.M. contributed to revising these ideas over time and maintaining clinical relevance. M.V.D.M. and M.S. performed data extraction and outcomes adjudication. M.R.F. performed all statistical analyses; K.S.H. and M.S. checked these analyses. M.R.F. created the figures and tables. M.R.F. primarily wrote the paper, with assistance from K.S.H. All authors reviewed the manuscript. K.S.H. and M.V.D.M. are both considered senior authors on this manuscript.
Ethics Statement
Approval was granted for the “Fontan at Altitude Registry (FAR)”, protocol #14-1072, by the Colorado Multiple Institutional Review Board (COMIRB) originally on 11 June 2014 and most recently on 8 September 2023. Actions by COMIRB, and in my research practice, are guided by the principles of respect for persons, beneficence, and justice set forth in the Ethical Principles and Guidelines for the Protection of Human Subjects of Research (often referred to as the Belmont Report). Please note that the Belmont Report and the Declaration of Helsinki are both foundational documents that outline ethical principles for conducting research involving human subjects. The Belmont Report emphasizes respect for persons, beneficence, and justice, while the Declaration of Helsinki focuses on the well-being of research participants and the importance of informed consent.
Informed Consent Statement
Because all data used in this study were collected in standard-of-care treatment, data collection was granted a waiver of consent by our institutional review board.
Data Availability Statement
The anonymized data underlying this study are not publicly available due to privacy and ethical considerations. Access may be granted on a case-by-case basis to qualified researchers for non-commercial purposes, subject to approval by the institutional review board and execution of a data use agreement. Requests for data access should be directed to the corresponding author.
Funding
This research was supported by the Jayden DeLuca Foundation, NIH CTSA Grant UL1 TR002535, and the American Heart Association Children’s Heart Foundation Predoctoral Congenital Heart Defect Research Award 20PRE35260057 to MRF.
Declaration of Competing Interest
The authors have no relevant financial or non-financial interests to disclose.
Abbreviations
SVD, single ventricle disease; PLE, protein losing enteropathy; PB, plastic bronchitis; FALD, Fontan-associated liver disease; PC MRI, phase contrast magnetic resonance imaging; VVCR, ventricular vascular coupling ration; VO2, rate of oxygen consumption; AAo, ascending aorta; SVC, superior vena cava; IVC, inferior vena cava; LPA, left pulmonary artery; cMRI, cardiac MRI; TCPC, total cavopulmonary connection; PCA, principal component analysis; PCs, principal components; EF, ejection fraction; EDVi, end diastolic volume index; ESVi, end systolic volume index; SVi, stroke volume index; CO, cardiac output; CI, cardiac index; BNP, B-type natriuretic peptide; GGT, gamma-glutamyl transferase; AST, aspartate aminotransferase; SaO2, arterial oxygen saturation; FEV1, forced expiratory volume in one second; mSVCP, mean SVC pressure; mPAP, mean pulmonary artery pressure; HLHS, hypoplastic left heart syndrome; TA, tricuspid atresia; double outlet right ventricle, DORV; double inlet left ventricle, DILV; hypoplastic right heart syndrome, HRHS; TCPC, total cavopulmonary circuit; FVC, forced vital capacity; RV, residual volume; TLC, total lung capacity; Alk phos, alkaline phosphatase; BUN, blood urea nitrogen.
References
-
1.
Kritzmire SM, Cossu AE. Hypoplastic Left Heart Syndrome. In StatPearls; StatPearls Publishing: Treasure Island, FL, USA, 2020.
-
2.
Rychik J. Forty years of the Fontan operation: a failed strategy.
Semin. Thorac. Cardiovasc. Surg. Pediatr. Card. Surg. Annu. 2010,
13, 96–100.
[Google Scholar]
-
3.
Lee YK, Lee ER, Park BU. PRINCIPAL COMPONENT ANALYSIS IN VERY HIGH-DIMENSIONAL SPACES.
Stat. Sin. 2012,
22, 933–956.
[Google Scholar]
-
4.
Witteveen E, Wieske L, van der Poll T, van der Schaaf M, van Schaik IN, Schultz MJ, et al. Increased Early Systemic Inflammation in ICU-Acquired Weakness; A Prospective Observational Cohort Study.
Crit. Care Med. 2017,
45, 972–979.
[Google Scholar]
-
5.
Qi Y, Jia JA, Li H, Wan N, Zhang S, Ma X. Lymphocyte-monocyte-neutrophil index: a predictor of severity of coronavirus disease 2019 patients produced by sparse principal component analysis.
Virol. J. 2021,
18, 115.
[Google Scholar]
-
6.
Kristono GA, Holley AS, Hally KE, Brunton-O’Sullivan MM, Shi B, Harding SA, et al. An IL-6-IL-8 score derived from principal component analysis is predictive of adverse outcome in acute myocardial infarction.
Cytokine X 2020,
2, 100037.
[Google Scholar]
-
7.
Federolf PA, Boyer KA, Andriacchi TP. Application of principal component analysis in clinical gait research: identification of systematic differences between healthy and medial knee-osteoarthritic gait.
J. Biomech. 2013,
46, 2173–2178.
[Google Scholar]
-
8.
Schäfer M, Frank BS, Humphries SM, Hunter KS, Carmody KL, Jacobsen R, et al. Flow profile characteristics in Fontan circulation are associated with the single ventricle dilation and function: principal component analysis study.
Am. J. Physiol. Heart Circ. Physiol. 2020,
318, H1032–H1040.
[Google Scholar]
-
9.
Ferrari MR, Schäfer M, Hunter KS, Di Maria MV. Coupled waveform patterns in the arterial and venous fontan circulation are related to parameters of pulmonary, lymphatic and cardiac function.
Int. J. Cardiol. Congenit. Heart Dis. 2023,
11, 100429.
[Google Scholar]
-
10.
Ferrari MR, Schäfer M, Hunter KS, Di Maria MV. Central Venous Waveform Patterns in the Fontan Circulation Independently Contribute to the Prediction of Composite Survival.
Pediatr. Cardiol. 2023,
45, 1617–1626.
[Google Scholar]
-
11.
Schäfer M, Ivy DD, Barker AJ, Kheyfets V, Shandas R, Abman SH, et al. Characterization of CMR-derived haemodynamic data in children with pulmonary arterial hypertension.
Eur. HeartJ. —Cardiovasc. Imaging 2016,
18, 424–431.
[Google Scholar]
-
12.
Schäfer M, Kheyfets VO, Schroeder JD, Dunning J, Shandas R, Buckner JK, et al. Main pulmonary arterial wall shear stress correlates with invasive hemodynamics and stiffness in pulmonary hypertension.
Pulm. Circ. 2016,
6, 37–45.
[Google Scholar]
-
13.
Ghelani SJ, Lu M, Sleeper LA, Prakash A, Castellanos DA, Clair NS, et al. Longitudinal changes in ventricular size and function are associated with death and transplantation late after the Fontan operation.
J. Cardiovasc. Magn. Reson. 2022,
24, 56.
[Google Scholar]
-
14.
Rathod RH, Prakash A, Kim YY, Germanakis IE, Powell AJ, Gauvreau K, et al. Cardiac magnetic resonance parameters predict transplantation-free survival in patients with fontan circulation.
Circ. Cardiovasc. Imaging 2014,
7, 502–509.
[Google Scholar]
-
15.
Ishizaki U, Nagao M, Shiina Y, Inai K, Mori H, Takahashi T, et al. Global strain and dyssynchrony of the single ventricle predict adverse cardiac events after the Fontan procedure: Analysis using feature-tracking cine magnetic resonance imaging.
J. Cardiol. 2019,
73, 163–170.
[Google Scholar]
-
16.
Saiki H, Eidem BW, Ohtani T, Grogan MA, Redfield MM. Ventricular-Arterial Function and Coupling in the Adult Fontan Circulation.
J. Am. Heart Assoc. 2016,
5, e003887.
[Google Scholar]
-
17.
Diller GP, Dimopoulos K, Okonko D, Li W, Babu-Narayan SV, Broberg CS, et al. Exercise intolerance in adult congenital heart disease: comparative severity, correlates, and prognostic implication.
Circulation 2005,
112, 828–835.
[Google Scholar]
-
18.
Mori M, Hebson C, Shioda K, Elder RW, Kogon BE, Rodriguez FH, et al. Catheter-measured Hemodynamics of Adult Fontan Circulation: Associations with Adverse Event and End-organ Dysfunctions.
Congenit. Heart Dis. 2016,
11, 589–597.
[Google Scholar]
-
19.
Loomba RS, Frommelt PC, Anderson RH, Flores S, Tweddell JS. Timing of Fontan Completion in Children with Functionally Univentricular Hearts and Isomerism: The Impact of Age, Weight, and Pre-Fontan Arterial Oxygen Saturation.
Pediatr. Cardiol. 2019,
40, 753–761.
[Google Scholar]
-
20.
Tomkiewicz-Pajak L, Plazak W, Kolcz J, Pajak J, Kopec G, Dluzniewska N, et al. Iron deficiency and hematological changes in adult patients after Fontan operation.
J. Cardiol. 2014,
64, 384–389.
[Google Scholar]
-
21.
Cheng AL, Takao CM, Wenby RB, Meiselman HJ, Wood JC, Detterich JA. Elevated Low-Shear Blood Viscosity is Associated with Decreased Pulmonary Blood Flow in Children with Univentricular Heart Defects.
Pediatr. Cardiol. 2016,
37, 789–801.
[Google Scholar]
-
22.
Schafer JL. Multiple imputation: a primer.
Stat. Methods Med. Res. 1999,
8, 3–15.
[Google Scholar]
-
23.
Rychik J, Atz AM, Celermajer DS, Deal BJ, Gatzoulis MA, Gewillig MH, et al. Evaluation and Management of the Child and Adult With Fontan Circulation: A Scientific Statement from the American Heart Association.
Circulation 2019,
140, e234–e284.
[Google Scholar]
-
24.
Papadopoulou-Legbelou K, Kavga M, Fotoulaki M. Protein-losing enteropathy after Fontan operation: enteric capsule findings and management with atrial pacing.
Hippokratia 2017,
21, 208.
[Google Scholar]
-
25.
Chin AJ, Stephens P, Goldmuntz E, Leonard MB. Serum alkaline phosphatase reflects post-Fontan hemodynamics in children.
Pediatr. Cardiol. 2009,
30, 138–145.
[Google Scholar]