
Beyond Protected Areas: Contrasting Habitat Associations and Anthropogenic Pressures on Three Carnivores in the Atlantic Forest of Misiones, Argentina

Beyond Protected Areas: Contrasting Habitat Associations and Anthropogenic Pressures on Three Carnivores in the Atlantic Forest of Misiones, Argentina
Karen E. DeMatteo
1,2,*
 Orlando M. Escalante
3,4,5
Delfina Sotorres
3,4,6
Katherina A. Vizcaychipi
7,8,9
Miguel A. Rinas
10
Carina F. Argüelles
3,4
Orlando M. Escalante
3,4,5
Delfina Sotorres
3,4,6
Katherina A. Vizcaychipi
7,8,9
Miguel A. Rinas
10
Carina F. Argüelles
3,4
Received: 10 August 2026 Revised: 19 August 2026 Accepted: 21 August 2026 Published: 04 September 2026

© 2026 The authors. This is an open access article under the Creative Commons Attribution 4.0 International License (https://creativecommons.org/licenses/by/4.0/).
Graphical Abstract
1. Introduction
The expanding human footprint has increasingly fragmented broad tracts of intact ecosystems, replacing them with heterogeneous landscapes that combine human-modified habitats, including agricultural land, pasture, and monoculture plantations, with road networks, and pervasive human activity [1,2]. This transformation forces wildlife to navigate complex habitat matrices, increasing exposure to pressures that can threaten long-term persistence, including human–wildlife conflict, disease transmission from domestic animals, and direct persecution [3,4]. Intensification of agriculture and the resulting changes in landscape and demographic boundaries can increase contact among wildlife, livestock, and companion animals, potentially facilitating disease transmission [4,5]. Human-introduced toxicants, including anticoagulant rodenticides, herbicides, and pesticides, represent an additional and comparatively underrecognized threat to nontarget wildlife [6].
Within the Atlantic Forest, sympatric carnivores differ in their ability to persist in fragmented and human-modified landscapes. Ecological niche modeling by DeMatteo et al. [7] found that the southern tiger cat (Leopardus guttulus), bush dog (Speothos venaticus), and puma (Puma concolor) tolerated fragmented and human-modified habitats more readily than jaguar (Panthera onca) and ocelot (Leopardus pardalis), which showed a stronger association with forest tracts and lower tolerance for altered landscapes. Among the three focal species, however, puma had less total suitable habitat, and slightly less suitable habitat outside protected areas than the southern tiger cat and bush dog, whereas puma and bush dog had greater proportions of marginal habitat outside protected areas than the southern tiger cat [7]. These differences provide a useful comparative framework for examining how carnivores with contrasting habitat associations respond to anthropogenic landscapes.
The three species also differ in their ecological and conservation vulnerabilities and in their formal conservation status. The southern tiger cat is listed as Vulnerable with a decreasing population trend both globally (IUCN Red List) and within Argentina (SAREM) [8,9]. The species is principally threatened by habitat loss and fragmentation associated with deforestation, and it occurs at low densities even within protected areas; retaliatory killing associated with poultry depredation and road mortality imposes additional pressure [10]. The bush dog is listed as Near Threatened globally but Vulnerable within Argentina [11,12], indicating a locally elevated conservation concern not fully captured by its global assessment. The species typically does not prey on livestock but may occasionally target domestic poultry [13]. Its wide-ranging behavior, together with that of pumas, may require frequent movement among forest fragments, increasing opportunities for encounters with roads, settlements, and domestic animals. Puma is listed as Least Concern both globally and within Argentina, with a decreasing global population trend but a locally stable population in Argentina [14,15]. Despite its comparatively secure status, puma is more fragmentation-sensitive than southern tiger cats and bush dogs within the Atlantic Forest and faces habitat loss, prey depletion, road mortality, and retaliatory killing following livestock depredation [16,17].
Domestic dogs are of conservation concern because they can act as both predators and competitors and as reservoirs of pathogens that can infect wildlife. Generalist pathogens can be maintained by abundant domestic reservoir hosts and subsequently spill over into less abundant wild populations [18]; indeed, an estimated 90.9% of pathogens affecting domestic carnivores can also infect wildlife, and such pathogens have contributed to outbreaks in endangered species elsewhere [19,20]. For southern tiger cats, domestic dogs may represent both predation and disease risk, including exposure to parvovirus and canine distemper virus. In the northern tiger cat (Leopardus tigrinus), domestic dogs were recorded at 80% of camera-trap stations and overlapped spatially with an estimated 65% of the protected area studied, with disease transmission and predation identified as major threats despite the species’ occurrence within protected habitat [10]. Pumas likewise share pathogens with domestic cats and dogs, including feline immunodeficiency virus, feline leukemia virus, and Bartonella spp. [21]. Bush dogs may be particularly vulnerable to disease introduction because their cohesive family groups can facilitate rapid transmission once a pathogen enters the group. Exposure may occur through direct contact with unvaccinated feral or semi-feral domestic dogs, including hunting dogs entering protected areas, or indirectly through fecal contamination [13,22,23,24,25,26,27]. Domestic dogs used by poachers to flush prey from underground dens may further increase opportunities for contact with bush dogs, linking persecution and disease risks [13,28].
Chemical exposure represents another potential pathway through which human-modified landscapes may affect carnivores. Anticoagulant rodenticides have been documented in a wide range of nontarget species, although evidence remains concentrated in North America, Europe, and New Zealand, likely reflecting geographic differences in research effort rather than the absence of risk elsewhere [29,30]. Pesticides may also bioaccumulate in fatty tissues and biomagnify through food webs, reaching concentrations in top predators that substantially exceed environmental background levels [31]. Environmental risk-assessment frameworks for these compounds remain concentrated in the Global North, whereas countries in the Global South, including Brazil, often lack comparable regulatory controls despite supporting exceptional biodiversity and expanding agricultural production [32,33]. In Argentina, the 2019 National Strategy Against the Use of Toxic Baits (Estrategia Nacional contra el uso de Cebos Tóxicos, ENCT) specifically targets threats to the Andean condor. Subsequent surveys found that rural residents frequently underestimated the risks posed by toxic baits to wildlife and domestic dogs, prompting calls for national legislation regulating agrochemical traceability and prescription [34]. Whether comparable protections adequately address risks to carnivores in the Atlantic Forest remains unclear.
The spatial extent of formal protection presents an additional conservation challenge. Carnivores and their prey frequently occur outside protected areas, including on private properties and within extensive monoculture plantations managed by forestry companies, emphasizing the importance of conservation strategies that extend beyond provincial park boundaries in Misiones [7,35,36,37,38]. This need is reinforced by uneven prey distribution across the landscape and by illegal hunting activity that frequently occurs on private parcels bordering provincial parks, potentially providing routes of access into protected areas. Despite the convergence of these pressures, landscape-scale studies of wildlife disease and toxicant exposure remain concentrated in the Northern Hemisphere, with comparatively few studies addressing South American carnivores [39,40]. Moreover, much of the available information on disease and toxicant exposure derives from invasive sampling or opportunistic carcass collection, approaches that may bias estimates of the spatial distribution of these threats.
Noninvasive detection-dog-based scat sampling provides an alternative approach for characterizing carnivore occurrence across heterogeneous landscapes. By locating olfactory evidence of animal presence independently of fixed sampling locations or carcass availability, detection dogs can facilitate sampling across protected forests, private lands, agricultural areas, and other human-modified habitats. This approach may be particularly valuable for addressing geographic and methodological gaps in the wildlife disease and toxicant literature, which remains concentrated in the Northern Hemisphere and relies heavily on invasive sampling methods that require physical capture or opportunistic carcass discovery, potentially biasing estimates of how these threats are distributed across a landscape [39,40]. Previous studies have demonstrated the effectiveness of this approach for locating target carnivore samples and discriminating them from morphologically similar nontarget scats in the Atlantic Forest [35,41,42,43,44,45]. However, how the occurrence of sympatric carnivores with contrasting habitat associations overlaps with multiple anthropogenic gradients across the fragmented Atlantic Forest of Misiones remains insufficiently characterized.
Taken together, these species-specific pathways—deforestation and low density in the southern tiger cat, group-living and den-based poaching exposure in the bush dog, and large home ranges with cross-species pathogen sharing in the puma—converge on a common vulnerability to domestic-animal-associated disease and human persecution. Each species arrives at that vulnerability by a different route, yet the shared endpoint is the same. Whether puma’s stronger association with continuous, protected forest translates into meaningfully lower overall exposure to the anthropogenic pressures examined here, relative to the more fragmentation-tolerant southern tiger cat and bush dog, remains a question this study is well positioned to address.
Here, we used noninvasive, detection-dog-based scat sampling conducted across five survey seasons in northern-central Misiones, Argentina, to examine the associations of southern tiger cats, bush dogs, and pumas with land use and anthropogenic pressures. Specifically, we aimed to: (1) characterize land-use composition and gradients of human population density, settlement proximity, protected-area association, and illegal-hunting proximity associated with occurrences of the three species; (2) compare their patterns of habitat association and anthropogenic exposure, using puma as a comparatively forest-dependent reference against which the greater fragmentation tolerance previously described for southern tiger cats and bush dogs could be evaluated; and (3) interpret these patterns in the context of potential disease and toxicant exposure pathways to identify conservation priorities within an increasingly human-modified landscape.
2. Materials and Methods
2.1. Study Area
This study was conducted in the northern-central Atlantic Forest of Misiones Province, Argentina, part of the Upper Paraná Atlantic Forest ecoregion, one of the most biologically diverse and threatened tropical forest regions globally [46,47]. Misiones is bordered by Brazil and Paraguay, and although 90–95% of the province was historically covered by Atlantic Forest, land-use change driven by agricultural expansion, forestry, and settlement has left the province a mosaic of native forest (45.2%), agricultural land (19.4%), and monoculture plantations (10%) [48,49]. Differences in colonization history and protection effort have produced marked land-use contrasts within Misiones: most remaining forest (66.1%) occurs in the northern-central region, where our surveys were concentrated, and roughly 40% of forest province-wide falls within formally protected areas, including several provincial parks and the UNESCO-designated Yabotí Biosphere Reserve [48,50]. Even where forest remains unprotected, the effectiveness of protection against poaching and other extractive pressures varies considerably among reserves, with consequences that differ among medium- and large-mammal species [51,52]. The region has a humid subtropical climate without a distinct dry season; average monthly rainfall exceeds 100 mm and typically surpasses 200 mm in October and November. The hot season (late September to mid-April) is characterized by warm days (30–35 °C) and moderate nights (18–24 °C), while the cool season brings moderate days (23–27 °C) and cool nights (9–12 °C) [53].
2.2. Field Surveys and Scat Collection
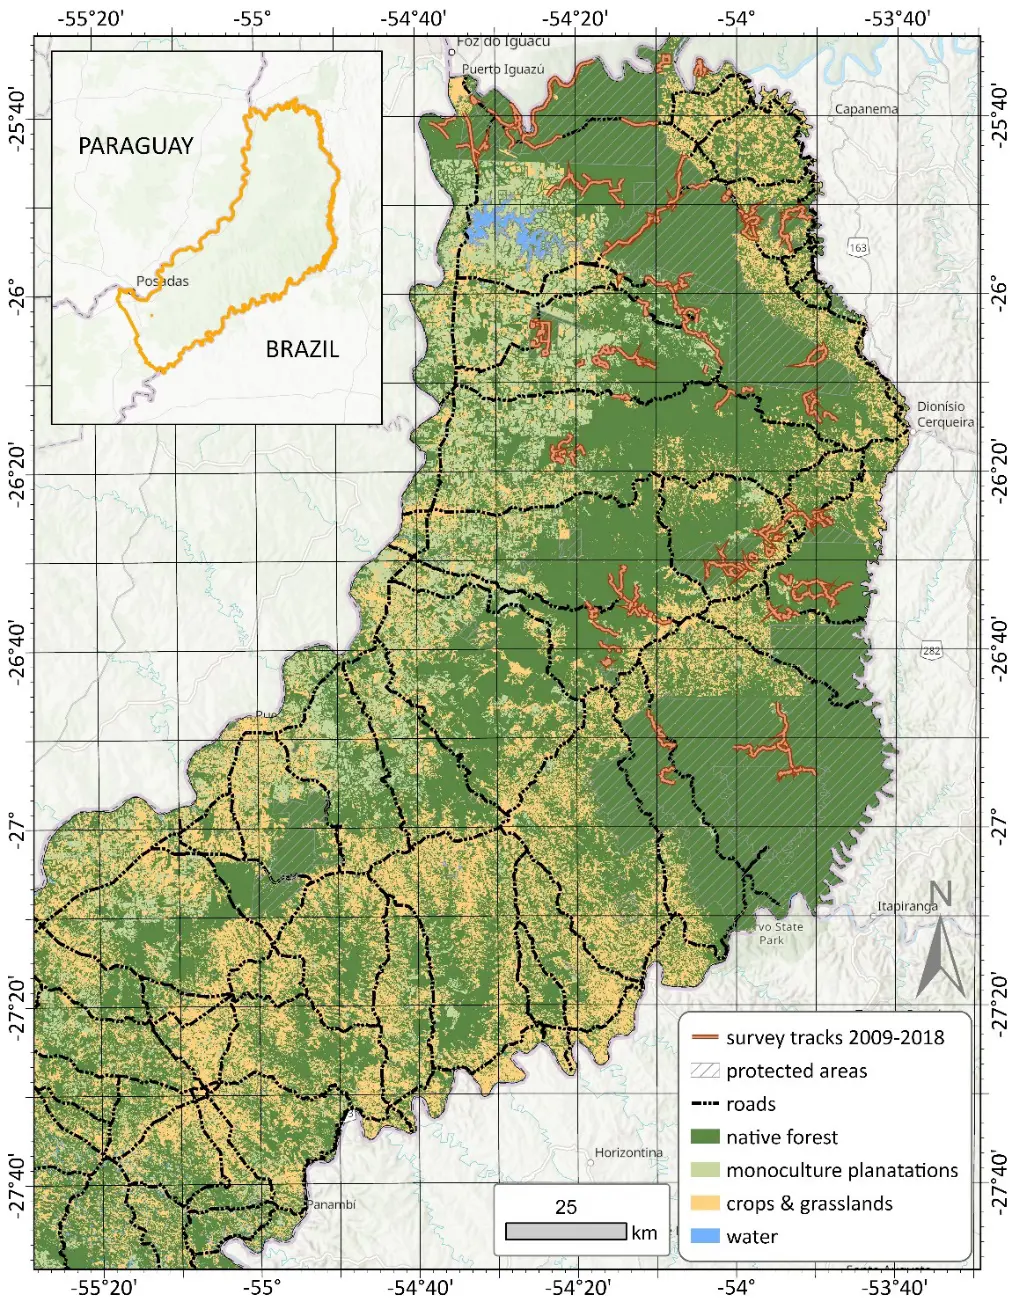
Field data were collected during five survey seasons (2009, 2011, 2013, 2016, and 2018), conducted primarily during the cool season (May–August) in the northern-central region of Misiones, Argentina. Surveys were completed along 257 unique routes encompassing a range of habitat types and travel corridors, including two-lane paved roads, one- and two-lane dirt roads, established machete-cut trails, illegal hunting trails, and animal trails. In total, 1613.7 km were surveyed [mean (SD) = 6.28 (3.62) km per route; range = 0.23–21.06 km; Figure 1]. Survey effort was greater in the northern zone (992.4 km; 61.5%) than in the central zone (621.3 km; 38.5%), and nearly half of the total distance surveyed (747.1 km; 46.3%) occurred outside protected areas. Consequently, sampling encompassed not only protected native forests but also private forest fragments, small-scale agricultural areas, pine and eucalyptus plantations, pastures, rural communities, and other human-modified landscapes. This broad sampling design was intended to capture the full range of environmental and anthropogenic conditions encountered by carnivores within the northern-central Atlantic Forest of Misiones.
A single conservation detection dog was used throughout all survey seasons to locate scat from five target carnivore species: jaguar, puma, ocelot, southern tiger cat, and bush dog. Detection dogs provide an efficient method for surveying wide-ranging carnivores in the rugged Atlantic Forest by locating olfactory evidence associated with animal movement and behavior rather than relying on animals visiting fixed sampling locations. Previous studies have demonstrated the effectiveness of this approach for locating target samples and discriminating them from morphologically similar nontarget scats in the Atlantic Forest [35,41,42,43]. The same protocols for dog training, scat collection, genetic sampling, and field data recording were used consistently across all survey seasons to ensure methodological comparability among years.
All research activities were conducted under permits issued by the Ministerio de Ecología y Recursos Naturales Renovables de Misiones (MEyRNR), including authorization for sample collection within provincial protected areas and export of samples for genetic analyses. The Administración de Parques Nacionales (APN) provided permits for sample collection within national parks, while access to private properties was granted by forestry companies, reserve managers, and individual landowners. In accordance with the regulations of the Saint Louis Zoo Institutional Animal Care and Use Committee, this study did not require animal care and use approval because no animals were captured, handled, or otherwise directly manipulated during the study.
2.3. Genetic Species Identification
Scat swabs were processed using DNA extraction and species-identification protocols described previously [35,42,43]; a summary is provided here. DNA was extracted from two independent swabs per sample using a Qiagen DNeasyTM DNA extraction kit (Qiagen, Venlo, The Netherlands) following a modified protocol of Vynne [55]. Species identification was based on amplification of a 110-bp carnivore-specific region of the mitochondrial cytochrome b gene using primers developed by Farrell et al. [56] and modified PCR protocols adapted from Farrell et al. [56] and Miotto et al. [57]. Amplified products were sequenced using Applied Biosystems (ABI) Big-DyeTM Terminator v3.1 (Thermo Fisher Scientific, Waltham, MA, USA) and analyzed on an ABI 3100 Genetic Analyzer. Resulting sequences were edited and aligned in Lasergene SeqMan 8.1 (DNASTAR, Madison, WI, USA) and compared against GenBank reference sequences using BLAST [58] to determine species identity.
2.4. Genetic Individual Identification
Scat samples genetically identified as southern tiger cat or puma were subsequently genotyped to distinguish individuals, following methods described previously [43]. We used 12 dinucleotide microsatellite loci originally developed for the domestic cat [59,60] and previously used to screen blood, tissue, hair, and scat samples from felids [57,61,62,63]. Loci were amplified in three multiplex reactions at an annealing temperature of 53 °C using a Qiagen Multiplex PCR Kit (Qiagen, Venlo, The Netherlands), following the manufacturer’s instructions, with a positive control included in all reactions to standardize allele calling. Fragment sizes were determined on an ABI 3100 Genetic Analyzer and scored against a GS600LIZ molecular size standard (Thermo Fisher Scientific, Waltham, MA, USA) using GeneMapper 4.01 (Thermo Fisher Scientific, Waltham, MA, USA).
Scat samples genetically identified as bush dog were similarly genotyped to distinguish individuals, following methods described previously [42]. We used eight dinucleotide microsatellite loci previously optimized for noninvasive bush dog samples [64]. Loci were amplified in two multiplex reactions at an annealing temperature of 60 °C using a Qiagen Multiplex PCR Kit, following the manufacturer’s instructions, with a positive control included in all reactions to standardize allele calling. Fragment sizes were determined on an ABI 3100 Genetic Analyzer and scored against a GS600LIZ molecular size standard using GeneMapper 4.01.
For each locus, a genotype was confirmed by four identical homozygous profiles or two identical heterozygous profiles [65]. We estimated the probability that two siblings or related individuals would share the same genotype by chance (probability of identity for siblings, PID(sib)) [66] in GenAlEx 6.4 [67], which was also used to assign individual identities, confirmed by eye based on unique genotypes at a minimum of 10 microsatellite loci in puma (PID(sib) = 0.000023), 9 loci in southern tiger cat (PID(sib) = 0.00026), and 6 loci in bush dog (PID(sib) = 0.0045), each below the <0.01 threshold recommended by Waits et al. [66]. For all species, deviations from the Hardy-Weinberg equilibrium at each locus, linkage disequilibrium, and genic differentiation of alleles were tested with an alpha of 0.05 (Bonferroni-corrected) [68] using GenePop 4.0.10 [69], and tests for null alleles were performed using Micro-Checker 2.2.3 [70] with the Brookfield 1 equation. Allelic richness was calculated with and without rarefaction correction using HP-RARE v. J-6-2006 [71].
2.5. Human Population Density and Settlement Proximity
The first spatial analysis used the 1-km2 WorldPop population density dataset for Argentina from 2018 [72], which estimates the number of people per square kilometer using national population totals adjusted to match official United Nations (UN) population estimates prepared by the Population Division of the Department of Economic and Social Affairs of the UN Secretariat. These data were generated using a top-down unconstrained estimation approach, which is particularly appropriate where the accuracy of satellite-based settlement mapping is uncertain, especially for detecting small rural settlements such as those common in Misiones, Argentina. To identify both broad demographic patterns and localized areas of high human density, a mean focal statistic (moving window analysis) was conducted in ArcGIS Pro v3.7 (ESRI, Redlands, CA, USA). Neighborhood sizes were selected to approximate the average home range of each focal species, with a 10 × 10 cell neighborhood corresponding to approximately 100 km2 for bush dogs [25] and pumas [73,74], with a 5 × 5 cell neighborhood corresponding to approximately 25 km2 for southern tiger cats [75]. This approach provided an estimate of average human population density within an area equivalent to the typical home range of each species.
The second spatial analysis used the populated places point dataset from the Humanitarian OpenStreetMap Team [76], which categorizes settlements into four classes: hamlets, villages, towns, and cities. Hamlets represent the smallest rural communities, typically consisting of only a handful of houses and limited infrastructure, whereas villages, towns, and cities represent progressively larger and more developed settlements with increasing levels of services, infrastructure, and human activity. ArcGIS Pro v3.7 was used to calculate the Euclidean distance from each species occurrence to the nearest settlement within each populated-place category. These distance measures were used to quantify spatial proximity to human settlements and characterize gradients of anthropogenic influence across the landscape.
2.6. Land Use and Landscape Analysis
Data on land use were obtained from the 2018 MapBiomas land-cover dataset, which is derived from automated classification of satellite imagery [54]. These data were used to examine land-use composition associated with species occurrences at two spatial scales. First, ArcGIS Pro v3.7 was used to extract the land-use class corresponding to the exact location of each field-collected sample, thereby characterizing the immediate habitat associated with species detections. Second, a neighborhood analysis was conducted using the native 30 m × 30 m resolution of the MapBiomas dataset to evaluate habitat composition at a scale representative of the typical home range of each species. Neighborhood sizes were selected to approximate average home-range areas, with a 333 × 333 cell neighborhood corresponding to approximately 100 km2 (99.8 km2) for bush dogs [25] and pumas [73,74], with a 150 × 150 cell neighborhood corresponding to approximately 20 km2 (20.25 km2) for southern tiger cats [75]. This neighborhood size is slightly smaller than the 25 km2 used for the human population density analysis, reflecting the need to align with the finer 30 m × 30 m cell resolution of the MapBiomas dataset, which does not evenly subdivide into the same neighborhood dimensions used for the 1 km2 WorldPop grid.
Within each neighborhood, ArcGIS Pro v3.7 was used to calculate the frequency of individual land-use categories, including water, non-vegetated areas, forest, annual crops, perennial crops, wetlands, agriculture–pasture mosaics, grasslands, and monoculture plantations. Landscape heterogeneity was also quantified using the Shannon–Wiener diversity index based on the proportional representation of land-use categories within each neighborhood. Within the study area, higher values reflected a greater diversity of land-use types and were generally associated with more heterogeneous, human-modified landscapes. The frequency of each land-use category and the corresponding heterogeneity index were then extracted at species occurrence locations to characterize habitat composition and landscape structure within ecologically relevant areas surrounding each detection.
2.7. Protected Area Association
The spatial relationship between each species’ occurrence and protected areas was evaluated using spatial data on national parks, provincial parks, and private reserves, all of which are predominantly composed of native forest. ArcGIS Pro v3.7 was first used to determine whether each species occurrence was located inside or outside a protected area, and then to calculate the Euclidean distance from each occurrence to the nearest protected-area boundary. Together, these metrics were used to evaluate the extent to which species occurrences were spatially associated with protected native forest and their boundaries, to characterize potential gradients of anthropogenic influence across the landscape.
2.8. Proximity to Illegal Hunting Activity
During field surveys, the research team opportunistically documented evidence of illegal hunting, which is prohibited throughout Misiones Province. Field observations suggested that signs of hunting activity became increasingly common during the study period (2009–2018). Beginning in 2016, these observations were systematically recorded, with GPS (Garmin GPSMAP 64s) coordinates collected for each occurrence. Therefore, distance to hunting evidence is not necessarily comparable across the entire sampling period. Recorded evidence included active gunfire, artificial salt licks, machete-cut hunting trails, spent cartridges, and elevated hunting stands. ArcGIS Pro v3.7 was used to calculate the Euclidean distance from each species occurrence to the nearest recorded sign of illegal hunting activity. These distance measures were used to characterize spatial proximity to recorded signs of illegal hunting.
2.9. Statistical Analyses
This study was designed as a descriptive, multi-scale spatial assessment of carnivore occurrence in relation to land-use and anthropogenic gradients rather than as a test of formal statistical hypotheses. Accordingly, we did not conduct inferential statistical comparisons among species. Values reported in Table 1 and Table 2 and in the text (means, standard deviations, and ranges) summarize the distribution of land-use categories, human population density, and distances to settlements, protected areas, and illegal-hunting activity associated with occurrences of each species; they do not represent formally tested differences. Comparative language used throughout the Results and Discussion (e.g., “greater”, “higher”, “closer”) therefore refers to descriptive contrasts among these summary values rather than statistically significant differences.
Table 1. Summary of land-use categories associated with southern tiger cat (Leopardus guttulus; n = 714), bush dog (Speothos venaticus; n = 51), and puma (Puma concolor; n = 99) occurrences based on the 2018 MapBiomas land-cover dataset [54]. For the point-scale analysis, values represent the proportion (%) of occurrences (number of occurrences in parentheses) within each land-use category. For the home-range-scale analysis, values represent the mean frequency (%) of each land-use category ± SD (range: minimum–maximum) calculated within an area corresponding to the average home range of each species. Landscape heterogeneity was quantified using the Shannon–Wiener diversity index. Categories with no recorded values are indicated by “–”.
|
Land-Use Categories |
Southern Tiger Cat |
Bush Dog |
Puma |
|---|---|---|---|
|
point-scale |
|||
|
native forest |
78.4 (560) |
56.9 (29) |
86.9 (86) |
|
monoculture plantations |
11.1 (79) |
25.5 (13) |
8.1 (8) |
|
annual agricultural crops |
0.4 (3) |
3.9 (2) |
– |
|
agriculture–pasture mosaics |
2.8 (20) |
3.9 (2) |
– |
|
areas without vegetation |
0.3 (2) |
– |
– |
|
perennial agricultural crops |
7.0 (50) |
9.8 (5) |
5.0 (5) |
|
home-range scale |
|||
|
native forest |
85.5 ± 15.1 (19.2–100) |
76.6 ± 13.2 (51.2–99.4) |
87.7 ± 11.5 (53.1–99.7) |
|
monoculture plantations |
8.1 ± 12.4 (0–78.3) |
5.6 ± 6.7 (0–22.8) |
5.8 ± 8.1 (0–35.2) |
|
wetlands |
0 ± 0.1 (0–0.1) |
0.1 ± 0.4 (0–2.6) |
0 ± 0.4 (0–3.1) |
|
grasslands |
– |
0.1 ± 0.4 (0–2.4) |
0 ± 0.4 (0–2.9) |
|
annual agricultural crops |
1.1 ± 2.2 (0–18.6) |
4.3 ± 4.4 (0–14.6) |
0.8 ± 2.0 (0–12.4) |
|
agriculture–pasture mosaics |
2.4 ± 4.6 (0–31.4) |
7.9 ± 9.3 (0–31.6) |
1.6 ± 3.4 (0–24.5) |
|
areas without vegetation |
0.5 ± 1.8 (0–15.2) |
0.8 ± 1.2 (0–6) |
0.5 ± 1.3 (0–12.0) |
|
water |
– |
– |
– |
|
perennial agricultural crops |
2.2 ± 2.8 (0–23.5) |
4.1 ± 3.4 (0.4–10.1) |
1.8 ± 2.1 (0–15.4) |
|
landscape heterogeneity |
22 ± 19.8 (0–75.1) |
36.7 ± 17.3 (1.1–62.8) |
20.6 ± 16.7 (0.5–61.8) |
Table 2. Summary of metrics used to evaluate spatial proximity to human settlements and anthropogenic influence for southern tiger cat (Leopardus guttulus; n = 714), bush dog (Speothos venaticus; n = 51), and puma (Puma concolor; n = 99). Human population density was derived from the 2018 WorldPop dataset [72] and is reported as the mean number of people per square kilometer ± SD (range: minimum–maximum) calculated within an area corresponding to the average home range of each species. Distances to human settlements were calculated using the populated places dataset from the Humanitarian OpenStreetMap Team [76] and are reported as the mean distance (km) ± SD (range: minimum–maximum) from species occurrence locations to the nearest city (n = 1), town (n = 23), village (n = 102), or hamlet (n = 546). * Includes four southern tiger cat detections with unusually high localized human population density (197.4–859.9 people/km2) resulting from close proximity to towns (one within Parque Provincial Araucaria near San Pedro; three within Reserva Nacional Iguazú, land managed by the Argentine Army (Ejército), near Puerto Iguazú); these are exceptions rather than the general pattern, as the remaining 710 detections averaged 3.9 ± 4.5 people/km2 (range: 0.7–62.3).
|
Anthropogenic Proximity Metrics |
Southern Tiger Cat |
Bush Dog |
Puma |
|---|---|---|---|
|
point-scale: |
|||
|
human population density |
6.2 ± 36.3 (0.7–859.9 *) |
6.3 ± 8.6 (1.4–44.8) |
4.0 ± 3.7 (0.8–19.1) |
|
home-range scale: |
|||
|
city |
220.5 ± 19.03 (177.4–265.8) |
225.3 ± 28.1 (182.9–264) |
217.5 ± 20.4 (178.9–254.0) |
|
town |
24.7 ± 9.3 (1.2–45.9) |
21.2 ± 7.7 (7.1–32.5) |
25.5 ± 9.2 (8.7–45.7) |
|
village |
17.6 ± 11.1 (2.3–47.9) |
18.4 ± 8.9 (2.7–31.7) |
20.6 ± 11.0 (2.7–47.0) |
|
hamlet |
7.3 ± 6.6 (0.2–18.3) |
5.1 ± 3.1 (0.1–14) |
9.1 ± 4.3 (2.1–20.0) |
3. Results
3.1. Genetic Analyses
Individual-level genotyping, performed for a subset of samples, confirmed 222 genetically unique southern tiger cats from 351 successfully genotyped scats (155 individuals detected once, 63 individuals detected 2–5 times, and 4 individuals detected more than 5 times), 52 unique pumas from 69 genotyped scats (40 individuals detected once and 12 individuals detected 2–5 times), and 38 unique bush dogs from 42 genotyped scats (34 individuals detected once and 4 individuals detected twice). Individual identity could not be confirmed for the remaining scats of each species (southern tiger cat: 214 scats from 2009, 2011, and 2013, plus 149 scats from 2016 that were not genetically tested for individual identity; puma: 30 scats; bush dog: 9 scats), although the high proportion of singly detected individuals among genotyped samples suggests that most of these likely represent additional unique individuals rather than repeated detections. These results indicate that the species-level sample sizes reported throughout substantially undercount the number of individual animals detected, and that repeated sampling of the same individual is unlikely to be a major driver of the spatial patterns described below.
Of the 1451 scat samples collected during the five survey seasons, species identity was genetically confirmed for 1085 samples (74.8%) [7]. Failure to identify the remaining samples was primarily attributed to insufficient DNA quantity or quality and to urine contamination associated with scent-marking behavior [77]. Southern tiger cat accounted for most genetically confirmed samples (n = 714; 65.8%), followed by puma (n = 99; 9.1%) and bush dog (n = 51; 4.7%); together, these three focal species accounted for 79.6% of all genetically confirmed samples (n = 864). Ocelot (n = 145; 13.4%) and jaguar (n = 76; 7.0%) accounted for the remaining 20.4% (n = 221) but were not considered further in this study. Southern tiger cat (50.0% northern, 50.0% central) and puma (48.5% northern, 51.5% central) detections were evenly distributed between regions, while bush dog detections showed a similar pattern (56.9% northern, 43.1% central) [42]. Because individual-level genotyping was not performed, these values represent independent scat samples rather than confirmed unique individuals; some samples could reflect repeated detections of the same individual. Exact sample locations are not reported or displayed, in accordance with government requests to reduce the risk of targeted poaching of threatened and endangered carnivore species.
3.2. Land Use Characteristics
Land-use composition associated with species occurrences for southern tiger cats, bush dogs, and puma at both the point scale and home-range scale is summarized in Table 1. These species were primarily associated with native forest; southern tiger cat and puma occurrences were associated with a greater proportion of native forest at the point scale, whereas bush dog occurrences were associated with a greater proportion of monoculture plantations and other human-modified land-use types. At the home-range scale, native forest remained the dominant landscape component surrounding detections of all three species; however, bush dog occurrences were associated with a greater proportion of agricultural land uses and higher landscape heterogeneity than southern tiger cat and puma occurrences. These descriptive patterns indicate that while the three species were associated with forest-dominated landscapes, bush dogs were detected across a broader range of landscape conditions containing a greater diversity of land-use types.
3.3. Human Population Density and Settlement Proximity
Measures of potential human–wildlife overlap and anthropogenic influence were broadly similar among southern tiger cats, bush dogs, and pumas (Table 2). Average human population density within areas corresponding to the typical home range was nearly identical for the southern tiger cat and bush dog and somewhat lower for puma. All three species occurred at comparable distances from cities, towns, and villages. The largest descriptive difference among species was observed for hamlets, with bush dog occurrences located closer to the smallest rural settlements, on average, than southern tiger cat occurrences, whereas puma occurrences were farther away than either. Despite this difference, all three species were frequently detected in landscapes containing dispersed rural settlements, indicating substantial overlap with human-modified environments. At the point scale, southern tiger cat detections were similarly associated with low human population density on average, although four detections yielded exceptionally high values (197.4–859.9 people/km2) due to close proximity to towns: one within Parque Provincial Araucaria near the town of San Pedro, and three within Reserva Nacional Iguazú, land managed by the Argentine Army (Ejército) and situated closer to the town of Puerto Iguazú. Excluding these four points, which represent exceptions rather than the general pattern for this species, the remaining 710 detections averaged 3.9 ± 4.5 people/km2 (range: 0.7–62.3).
3.4. Protected Area Association
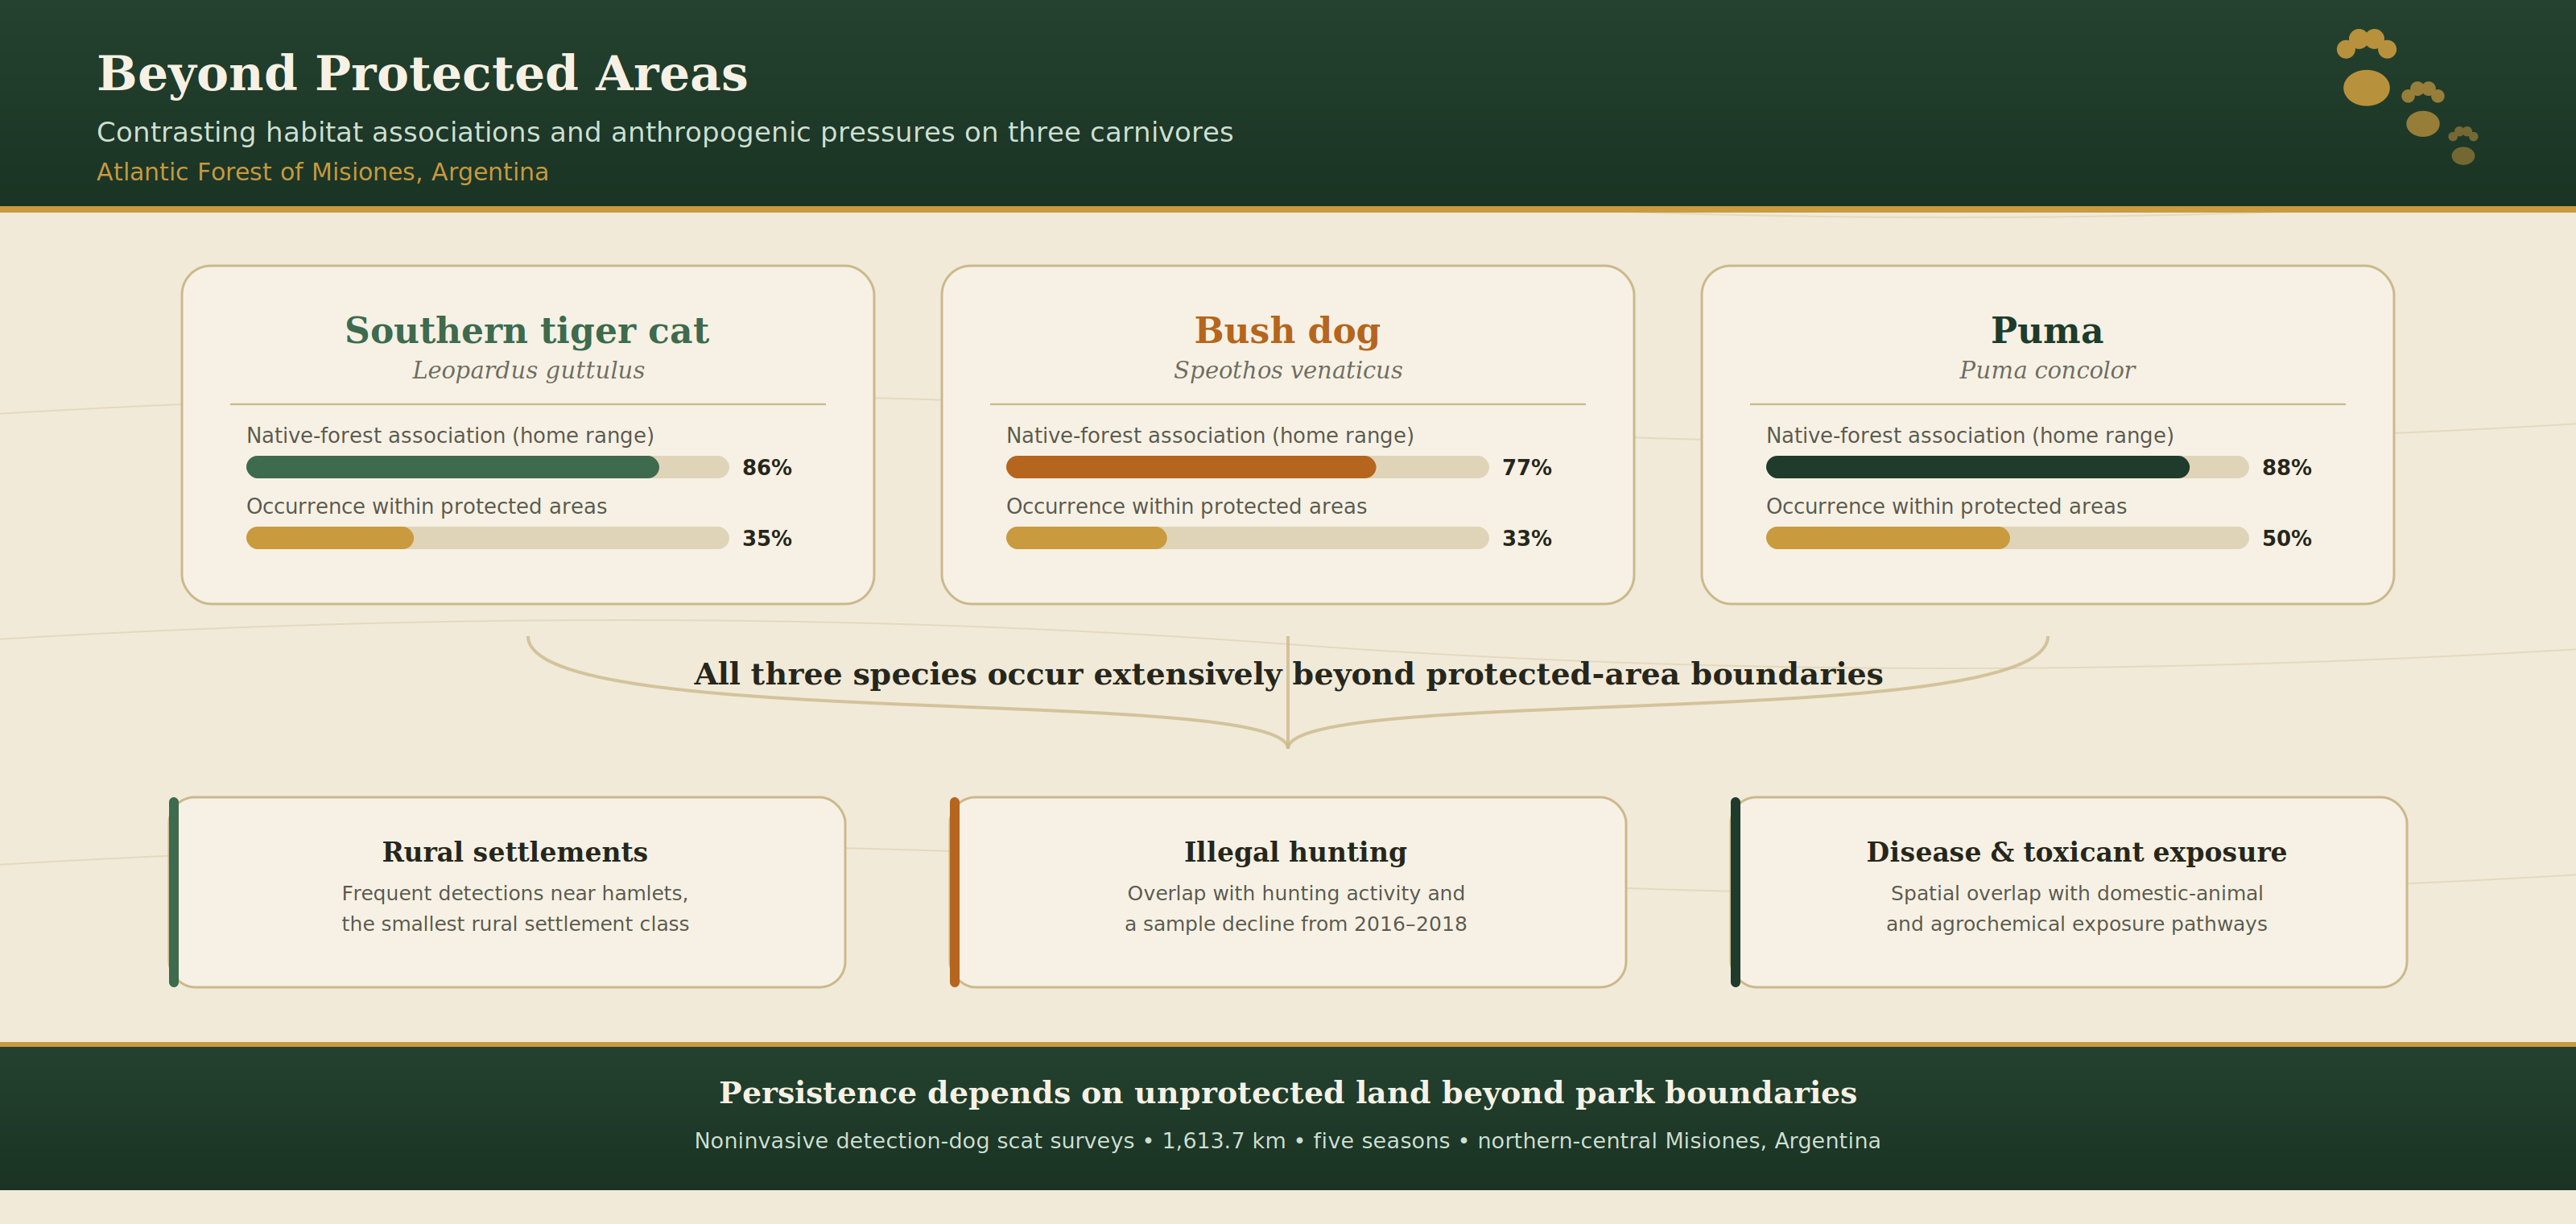
Approximately one-third of occurrence locations for both southern tiger cats and bush dogs were located within protected areas (southern tiger cat: 34.7%, n = 248; bush dog: 33.3%, n = 17), compared with half of occurrences for puma (50.5%, n = 50). When considering proximity to protected-area boundaries, southern tiger cat occurrences were located farthest from protected-area edges on average (3.6 ± 4.3 km), followed by bush dog and puma, which were similarly close (2.8 ± 4.0 km and 2.8 ± 3.9 km, respectively). Almost half of southern tiger cat (49.7%) and bush dog (43.1%) locations were within 5 km (mean ± SD: 1.6 ± 1.2 km and 1.8 ± 0.9 km, respectively) of a protected-area boundary, but nearly two-thirds of puma locations (69.7%) met this criterion, at an even shorter average distance (0.6 ± 1.3 km).
3.5. Illegal Hunting Proximity
Occurrence locations for bush dogs were, on average, farther from recorded evidence of illegal hunting activity than southern tiger cats (22.1 ± 19.7 km vs. 15.0 ± 17.2 km, respectively), with puma falling in the middle (19.0 ± 20.0 km). However, all three species showed substantial overlap in the range of distances to hunting activity (southern tiger cat: 1.2–62.2 km; bush dog: 0.12–58.4 km; puma: 0.0–59.0 km).
The scale of illegal hunting pressure was also reflected in carnivore sample collection across survey years. Despite comparable survey effort (approximately 500 km) and the use of the same detection dog in 2016 and 2018, total carnivore samples declined by 41.7% between these two years, a decline spanning species with markedly different body sizes and ranging behaviors rather than being restricted to a single functional group. The decline was most pronounced for the southern tiger cat (52.3%; from 149 samples in 2016 to 71 in 2018) and puma (66.7%; from 30 samples in 2016 to 10 in 2018), and coincided with an increase in documented hunting-sign detections over the same period. Because detection-dog sample counts can be influenced by factors other than population abundance, these values describe trends in sample collection rather than direct estimates of population change.
4. Discussion
4.1. Contrasting Land-Use Associations Among Carnivores
Southern tiger cats, bush dogs, and pumas differed in their patterns of habitat association across the anthropogenic gradient we examined, and these differences appear consistent with broader distinctions in fragmentation tolerance previously identified among sympatric Atlantic Forest carnivores [7]. Our empirical results add an interesting nuance to the pattern of puma having less predicted suitable habitat than the southern tiger cat or bush dog, despite all three being more fragmentation-tolerant than jaguar and ocelot. Despite puma’s comparatively lower predicted habitat suitability at the regional scale, it showed the strongest forest association of the three focal species, at both the point scale and the home-range scale, exceeding even the southern tiger cat. Bush dogs, by contrast, showed the weakest forest association at both scales and the greatest use of monoculture plantations and agriculture–pasture mosaics. Landscape heterogeneity followed the same ordering, with puma occupying the least heterogeneous landscapes, southern tiger cats intermediate, and bush dogs the most heterogeneous by a wide margin. Together, these results position puma as a comparatively forest-obligate reference point against which the greater habitat flexibility of the southern tiger cat, and especially the bush dog, stands out clearly. Even so, puma’s lower overall suitable habitat at the regional scale suggests its options for finding that forest-associated habitat may be more limited than either of the other two species.
Notably, the magnitude of this contrast differed between spatial scales: the gap in forest association was substantially larger at the point scale than at the home-range scale, both for bush dog versus southern tiger cat and for bush dog versus puma. This narrowing suggests that bush dogs occupy broadly forest-dominated landscapes similar to those used by the other two species, but are disproportionately detected within the non-forest patches embedded in those landscapes. However, this pattern need not reflect an active preference for modified habitat. An alternative explanation is that it reflects a balance between home-range size and habitat use. Because home-range neighborhood size in our analysis was assigned from published estimates rather than measured directly for each individual, we cannot formally partition ranging behavior from habitat selection; rather, this comparison is inferential. Bush dogs and puma were assigned comparably large home-range neighborhoods (approximately 5× larger than the southern tiger cat’s), yet only bush dogs showed this point-scale divergence into non-forest patches, suggesting that assigned range size alone does not explain the pattern. Puma, despite occupying a similarly large assigned neighborhood, maintained the strongest forest association of the three species at both scales, implying a comparatively low association for non-forest habitat that persists across that larger area. Bush dogs, by contrast, appear to combine a similarly large home range with somewhat greater use of the non-forest elements encountered within it—a difference in degree of habitat use, rather than in ranging behavior, that puma does not share.
4.2. Carnivores in the Rural Landscape
In contrast to the land-use results, measures of human population density and settlement proximity revealed few differences among the three species. This lack of differentiation, with nearly identical average human population densities within their respective home-range-scale neighborhoods and similar distances to populated places, was, in some respects, among the more striking results of this study. Specifically, despite contrasting land-use associations, none of the three species appeared restricted to areas of low human presence, and all routinely occurred within landscapes containing human settlements.
The clearest pattern to emerge from this component of the analysis was that all three species occurred substantially closer to hamlets than other settlement types. Hamlets represent the dominant settlement type across the rural matrix of the province, typically marking the interface between forest and small-scale agriculture and often associated with domestic animals, subsistence hunting, and edge habitat. Proximity of all three species to hamlets, rather than to larger population centers, suggests that these carnivores respond less to urbanization per se than to the pervasive matrix of dispersed rural settlement that characterizes much of the northern-central Atlantic Forest.
Bush dogs occurred marginally closer to hamlets on average than southern tiger cats, broadly consistent with their greater use of agricultural and plantation land uses, while puma occurred farther from hamlets than either species. We interpret the bush dog–southern tiger cat difference cautiously, given the comparatively small bush dog sample (n = 51) and the modest magnitude of the difference. Puma’s greater distance from hamlets, however, is consistent with its stronger forest and protected area association and may reflect genuinely reduced use of the immediate edge habitat surrounding rural settlements. Considered alongside the land-use results, this pattern suggests that raw human population density may be a poor predictor of anthropogenic pressure on these species: densities were uniformly low near almost all detections regardless of settlement proximity. The spatial arrangement of settlements, roads, and human activity—rather than the number of people per se—may be the more relevant axis of anthropogenic influence for these carnivores, a possibility that gains further support when considered alongside the protected-area and illegal-hunting results below.
4.3. Protected Areas, Hunting, and the Surrounding Matrix
The relatively low proportion of southern tiger cat and bush dog detections within protected areas reinforces a pattern already suggested by the regional niche modeling of DeMatteo et al. [7], in which both species showed the greatest proportion of suitable habitat located outside protected areas among Atlantic Forest carnivores. Puma’s higher proportion of within-park detections, and its markedly closer and more concentrated distribution near protected-area edges, fit the same niche-modeling framework from the opposite direction. A species with comparatively lower fragmentation tolerance shows correspondingly stronger association with formally protected, core habitat. We do not interpret this contrast as evidence that puma depends on protected areas for persistence in a way the other two species do not. Rather, all three species were detected extensively within the broader landscape matrix, including private lands, and a substantial share of detections outside formal protection clustered immediately adjacent to park boundaries—most strikingly so for puma—suggesting that many individuals recorded outside formal protection may still depend on, or move regularly between, protected core habitat and the adjoining unprotected land. Conservation strategies focused solely on existing park boundaries are therefore unlikely to capture the full range of habitat currently supporting these populations, a finding particularly relevant to the Green Corridor initiative, which spans much of the study region and explicitly aims to maintain connectivity across a mixture of protected and private lands.
Occurrence locations for all three species also overlapped extensively with documented illegal hunting activity. Bush dogs were detected, on average, farther from recorded hunting evidence than southern tiger cats, with puma falling in between; however, the ranges for all three species overlapped substantially, indicating that none is reliably buffered from hunting pressure across the landscape. Although none of the three species is a primary target of hunting activity in the region, several of their principal prey species—including paca (Cuniculus paca) and agouti (Dasyprocta spp.)—are frequently harvested by hunters, and reductions in prey availability associated with hunting pressure may therefore indirectly affect all three carnivores. Hunters in this region commonly travel with domestic dogs, which may further increase opportunities for contact between domestic and wild canids in remote forest areas.
Carnivore sample collection also declined by 41.7% between 2016 and 2018 despite comparable survey effort and the use of the same detection dog in both years, a decline most pronounced for the southern tiger cat and puma, and observed across species of markedly different body size and ranging behavior. This decline coincided with an increase in documented illegal hunting activity, but because detection-dog sample counts can be influenced by factors other than population abundance—including animal movement, scat deposition rates, prey availability, environmental conditions, and survey effort—this pattern should be interpreted as raising concern and warranting further investigation rather than as direct evidence of population decline. Most documented illegal hunting activity in the northern-central zone occurred on large private parcels bordering provincial parks; these parcels may warrant targeted investigation as potential access routes into adjacent protected areas.
4.4. Conservation Implications and Potential Exposure Pathways
Collectively, these patterns identify multiple, potentially overlapping anthropogenic exposure pathways rather than measured effects on these carnivores. All three species occupy landscapes in which habitat modification, proximity to domestic animals, illegal hunting, and potential toxicant exposure spatially co-occur to varying degrees, even though forest remains the dominant landscape component for all three, and puma shows the strongest association with protected core habitat. Because domestic-dog abundance, pathogen exposure, toxicant exposure, and livestock density were not measured directly, we can establish spatial overlap with these anthropogenic features, but not that the underlying stressors interact or affect fitness. Direct measurement of these interactions—for example, pathogen prevalence, toxicant residue levels, or survival and reproductive outcomes relative to exposure—was beyond the scope of this study and is identified explicitly as a priority for future research.
Free-ranging domestic dogs are a well-documented source of pathogens for wild carnivores, and a comparable case study found that domestic-dog overlap, rather than habitat loss alone, was the principal conservation concern for a related tiger cat species despite its occurrence within a protected area [10]. Given the proximity of southern tiger cats and bush dogs to hamlets and other rural settlements documented here, a similar dynamic may be operating in Misiones, although population-level consequences remain unknown. Puma’s greater distance from hamlets and stronger association with protected core habitat may reduce this specific exposure route, but puma already shares several pathogens with domestic animals [21], and its larger home range means that even infrequent contact events could carry consequences for disease introduction into otherwise less-exposed forest interiors. Bush dogs, whose cohesive social groups may facilitate rapid pathogen spread once introduced, already carry multiple documented pathogens, including the cestode Echinococcus vogeli [78,79,80,81]; the den-flushing behavior associated with poaching, discussed above, offers one plausible mechanism linking hunting pressure directly to disease exposure for this species, distinct from prey depletion alone.
The agriculture–pasture mosaics used by bush dogs and, to a lesser extent, puma also raise the possibility of exposure to pathogens shared with domestic livestock (e.g., Echinococcus granulosus and tick-borne agents such as Anaplasma and Babesia spp.) [82,83] and to environmental toxicants including anticoagulant rodenticides, herbicides, and pesticides, which have been linked elsewhere to immune dysfunction and increased mange severity in other wild felids [84,85,86,87]. None of these exposure pathways were measured directly in this study; rather, the spatial patterns we document identify plausible, testable hypotheses that warrant direct investigation rather than an exhaustive review of every known threat.
4.5. Limitations and Future Research
Several limitations warrant consideration when interpreting these results. First, our data describe where scats were detected rather than habitat preference or quality, because habitat availability was not directly modeled; observed associations should therefore be interpreted as patterns of occurrence rather than selection. Second, the disease, toxicant, and livestock-associated exposure pathways discussed above were not measured in the collected samples; they are hypotheses generated by spatial overlap and require direct testing. Third, sample sizes differed substantially among species, and the bush dog sample (n = 51) in particular limits the precision of comparisons involving that species. Fourth, field surveys spanned 2009–2018, whereas several landscape layers (MapBiomas, WorldPop) reflect conditions in 2018 only, introducing potential temporal mismatch between occurrence data and anthropogenic covariates. Finally, evidence of illegal hunting was recorded systematically only from 2016 onward, so hunting-proximity comparisons are not temporally equivalent across the full survey period. None of these limitations undermines the patterns reported here, but acknowledging them clarifies the scope of the inferences that can be drawn and highlights priorities for future research. Additional follow-up surveys are planned in this region to evaluate whether carnivore occurrence and hunting pressure have continued to change since 2018.
5. Conclusions and Conservation Recommendations
Taken together, our results show that three sympatric carnivores use the fragmented landscape of northern-central Misiones differently, with puma showing the strongest forest and protected-area association and bush dogs the greatest association with heterogeneous, human-modified landscapes; southern tiger cats fell between these two patterns. All three species were detected extensively beyond protected-area boundaries, indicating that conservation strategies focused solely on existing parks are unlikely to sustain these populations and that the surrounding matrix and connectivity between protected and unprotected land must be considered explicitly. A multispecies corridor spanning this region has already been designed to optimize connectivity among protected areas. It has identified priority zones of high suitability for these three species and others [7,35,36], offering a practical framework for extending conservation planning beyond a strictly reserve-based, ‘fortress’ model toward one centered on landscape connectivity. Because the three species differ in their habitat associations, protected-area reliance, and specific threats, effective implementation will likely require differentiated, species-specific management alongside this shared corridor framework—for example, prioritizing hunting reduction and edge-habitat protection near reserve boundaries for puma, and broader landscape-level connectivity and domestic-dog management across the agricultural matrix for bush dogs. Finally, the spatial overlap we document between carnivore occurrence and settlements, illegal hunting, and human-modified land uses identifies potential exposure pathways—particularly related to settlement proximity and hunting—that warrant direct investigation of disease, toxicant, and demographic consequences. Noninvasive, detection-dog-based sampling, as used here, may be well suited to this future surveillance role, since it can locate samples across heterogeneous landscapes independent of habitat type or proximity to humans.
Acknowledgments
The Ministerio de Ecología y Recursos Naturales Renovables (MEyRNR) of Misiones and the Administración de Parques Nacionales of Argentina provided permits and assistance with field logistics. The MEyRNR provided housing. Numerous Argentinean students assisted in the field, and provincial/national park guards, NGOs, local conservationists, and private land/reserve owners helped with various aspects of this project in the field and the lab. The PackLeader Conservation Detection Dogs provided guidance. Of course, ‘Train’ made it all possible with his amazing work ethic.
Author Contributions
Conceptualization, K.E.D., M.A.R. and C.F.A.; Methodology, K.E.D.; Software, K.E.D.; Validation, K.E.D., O.M.E., D.S., K.A.V., M.A.R. and C.F.A.; Formal Analysis, K.E.D.; Investigation, K.E.D., O.M.E., D.S., K.A.V., M.A.R. and C.F.A.; Resources, K.E.D.; Data Curation, K.E.D.; Writing—Original Draft Preparation, K.E.D.; Writing—Review & Editing, K.E.D., O.M.E., D.S., K.A.V., M.A.R. and C.F.A.; Visualization, K.E.D.; Supervision, K.E.D., M.A.R. and C.F.A.; Project Administration, K.E.D., M.A.R. and C.F.A.; Funding Acquisition, K.E.D., M.A.R. and C.F.A.
Ethics Statement
Not applicable.
Informed Consent Statement
Not applicable.
Data Availability Statement
Because the locational data is associated with endangered and threatened endemic species (both carnivores and game species), the government desires to restrict open access to the data; however, they will provide access to the data if requested by researchers. Specifically, the MEyRNR will maintain a database of all results from this study and control the release of the data as a safeguard for the security of the animals, which poachers in the area often target. Interested qualified researchers can send requests for data to the current administration at https://ecologia.misiones.gob.ar/ (accessed on 21 July 2026).
Funding
The field and lab portions of this study were supported by Chester Zoo, the Conservation, Food and Health Foundation, Eppley Foundation for Research, Fresno Chaffee Zoo Wildlife Conservation Fund, Jaguar Conservation Fund (Woodland Park Zoo), Kickstarter, Kolmârden Foundation, Little Rock Zoo Foundation, National Geographic Society (C193-11 & C235-13), Palm Beach Zoo Conservation & Science Program, Paris Zoo, Phoenix Zoo Conservation & Science Program, Zoo Atlanta (Georgia AAZK, Reeder Conservation & Science Program, & Quarters for Conservation), Riverbanks Zoo and Garden, Sequoia Park Zoo, and the New England Conservation Committee.
Declaration of Competing Interest
The authors declare that they have no known competing financial interests or personal relationships that could have appeared to influence the work reported in this paper.
References
- Venter O, Sanderson EW, Magrach A, Allan JR, Beher J, Jones KR, et al. Global terrestrial Human Footprint maps for 1993 and 2009. Sci. Data 2016, 3, 160067. DOI:10.1038/sdata.2016.67 [Google Scholar]
- Venter O, Sanderson EW, Magrach A, Allan JR, Beher J, Jones KR, et al. Sixteen years of change in the global terrestrial human footprint and implications for biodiversity conservation. Nat. Commun. 2016, 7, 12558. DOI:10.1038/ncomms12558 [Google Scholar]
- Hughes J, Macdonald DW. A review of the interactions between free-roaming domestic dogs and wildlife. Biol. Conserv. 2013, 157, 341–351. DOI:10.1016/j.biocon.2012.07.005 [Google Scholar]
- Siembieda JL, Kock RA, McCracken TA, Newman SH. The role of wildlife in transboundary animal diseases. Anim. Health Res. Rev. 2011, 12, 95–111. DOI:10.1017/S1466252311000041 [Google Scholar]
- Brearley G, Rhodes J, Bradley A, Baxter G, Seabrook L, Lunney D, et al. Wildlife disease prevalence in human‐modified landscapes. Biol. Rev. 2013, 88, 427–442. DOI:10.1111/brv.12009 [Google Scholar]
- Serieys LEK, Lea A, Pollinger JP, Riley SPD, Wayne RK. Disease and freeways drive genetic change in urban bobcat populations. Evol. Appl. 2015, 8, 75–92. DOI:10.1111/eva.12226 [Google Scholar]
- DeMatteo KE, Escalante OM, Ibañez Alegre DM, Rinas MA, Sotorres D, Argüelles CF. A multispecies corridor in a fragmented landscape: Evaluating effectiveness and identifying high-priority target areas. PLoS ONE 2023, 18, e0283258. DOI:10.1371/journal.pone.0283258 [Google Scholar]
- de Oliveira T, Trigo T, Tortato M, Paviolo A, Bianchi R, Leite-Pitman MR. Leopardus guttulus. The IUCN Red List of Threatened Species 2016: e.T54010476A54010576. Available online: https://www.iucnredlist.org/species/54010476/54010576 (accessed on 19 August 2026).
- Cruz P, Di Bitetti M, Varela D, Arrabal J. Leopardus guttulus. In Actualización de las categorías de conservación de los mamíferos de Argentina según su riesgo de extinción; Sociedad Argentina para el Estudio de los Mamíferos: Mendoza, Argentina, 2025. [Google Scholar]
- de Oliveira TG, Lima BC, Fox-Rosales L, Pereira RS, Pontes-Araújo E, de Sousa AL. A refined population and conservation assessment of the elusive and endangered northern tiger cat (Leopardus tigrinus) in its key worldwide conservation area in Brazil. Glob. Ecol. Conserv. 2020, 22, e00927. DOI:10.1016/j.gecco.2020.e00927 [Google Scholar]
- DeMatteo K, Michalski F, Leite-Pitman MRP. Speothos venaticus. The IUCN Red List of Threatened Species 2011: e.T20468A9203243. Available online: https://www.researchgate.net/publication/235940341_Speothos_venaticus_-_Red_List_Evaluation (accessed on 19 August 2026).
- Varela D, Paviolo A, Arrabal JP. Speothos venaticus. In Actualización de las categorías de conservación de los mamíferos de Argentina según su riesgo de extinción; Sociedad Argentina para el Estudio de los Mamíferos: Mendoza, Argentina, 2025. [Google Scholar]
- DeMatteo KE. Using a Survey of Carnivore Conservationists to Gain Insight into the Ecology and Conservation Status of the Bush Dog. Canid News. 2008. Available online: http://www.canids.org/canidnews/11/Bush_dog_data_survey.pdf (accessed on 25 January 2009).
- Nielsen C, Thompson D, Kelly M, Lopez-Gonzalez CA. Puma concolor. The IUCN Red List of Threatened Species 2015: e.T18868A97216466. Available online: https://www.iucnredlist.org/species/18868/97216466 (accessed on 19 August 2026).
- De Angelo C, Lucherini M, Fernández GP, Donadio E, Campos CM, Romero VL, et al. Puma concolor. In Actualización de las categorías de conservación de los mamíferos de Argentina según su riesgo de extinción; Sociedad Argentina para el Estudio de los Mamíferos: Mendoza, Argentina, 2025. [Google Scholar]
- Guerisoli MM, Gallo O, Martinez S, Luengos Vidal EM, Lucherini M. Native, exotic, and livestock prey: Assessment of puma Puma concolor diet in South American temperate region. Mammal Res. 2021, 66, 33–43. DOI:10.1007/s13364-020-00549-0 [Google Scholar]
- Zanón Martínez JI, Iranzo EC, Travaini A, McNitt DC, Mansilla AP, Llanos R, et al. Puma density, habitat use, and activity patterns across a mosaic landscape of ranches, game reserves, and a protected area in central Argentina. Eur. J. Wildl. Res. 2023, 69, 89. DOI:10.1007/s10344-023-01717-8 [Google Scholar]
- Woodroffe R, Prager KC, Munson L, Conrad PA, Dubovi EJ, Mazet JAK. Contact with Domestic Dogs Increases Pathogen Exposure in Endangered African Wild Dogs (Lycaon pictus). PLoS ONE 2012, 7, e30099. DOI:10.1371/journal.pone.0030099 [Google Scholar]
- Cleaveland S, Laurenson MK, Taylor LH. Diseases of humans and their domestic mammals: Pathogen characteristics, host range and the risk of emergence. Philos. Trans. R. Soc. B 2001, 356, 991–999. DOI:10.1098/rstb.2001.0889 [Google Scholar]
- McCallum H, Dobson A. Detecting disease and parasite threats to endangered species and ecosystems. Trends Ecol. Evol. 1995, 10, 190–194. DOI:10.1016/S0169-5347(00)89050-3 [Google Scholar]
- Bevins SN, Carver S, Boydston EE, Lyren LM, Alldredge M, Logan KA, et al. Three Pathogens in Sympatric Populations of Pumas, Bobcats, and Domestic Cats: Implications for Infectious Disease Transmission. PLoS ONE 2012, 7, e31403. DOI:10.1371/journal.pone.0031403 [Google Scholar]
- Jorge RS, Morato RG, Pereira M, Lima ES, Scheffer K, Carnieli P, Jr., et al. Rabies antibodies in a bush dog captured in the Pantanal, Brazil. In Proceedings of the 56th Annual Wildlife Disease Association Conference, Estes Park, CO, USA, 12–17 August 2007; p. 94. [Google Scholar]
- Jorge RSP, Nunes CM, Trinconi CM, Paula HB, Dias AKK, Ferreira F. Leishmania spp. in wild carnivores captured in the Pantanal, Brazil. In Proceedings of the 56th Annual Wildlife Disease Association Conference, Estes Park, CO, USA, 12–17 August 2007; p. 42. [Google Scholar]
- Pitman RL, Verme FN, Davenport LC. Amenaza de enfermedades epidémicas a la conservación de carnívoros silvestres en la Amazonía peruana; Center for Tropical Conservation: Durham, NC, USA, 2003; INRENA: Lima, Peru, 2003. [Google Scholar]
- Lima EDS, DeMatteo KE, Jorge RSP, Jorge MLSP, Dalponte JC, Lima HS, et al. First telemetry study of bush dogs: Home range, activity and habitat selection. Wildl. Res. 2012, 39, 512–519. DOI:10.1071/WR11176 [Google Scholar]
- Mann PC, Bush M, Appel MJG, Beehler BA, Montali RJ. Canine Parvovirus Infection in South American Canids. J. Am. Vet. Med. Assoc. 1980, 177, 779–783. DOI:10.2460/javma.1980.177.09.779 [Google Scholar]
- Steinel A, Parrish CR, Bloom ME, Truyen U. Parvovirus Infections in Wild Carnivores. J. Wildl. Dis. 2001, 37, 594–607. DOI:10.7589/0090-3558-37.3.594 [Google Scholar]
- Lessa I, Guimarães TC, de Godoy Bergallo H, Cunha A, Vieira EM. Domestic dogs in protected areas: A threat to Brazilian mammals? Nat. Conserv. 2016, 14, 46–56. DOI:10.1016/j.ncon.2016.05.001 [Google Scholar]
- Nakayama SMM, Morita A, Ikenaka Y, Mizukawa H, Ishizuka M. A review: Poisoning by anticoagulant rodenticides in non-target animals globally. J. Vet. Med. Sci. 2019, 81, 298–313. DOI:10.1292/jvms.17-0717 [Google Scholar]
- Keating MP, Saldo EA, Frair JL, Cunningham SA, Mateo R, Jachowski DS. Global review of anticoagulant rodenticide exposure in wild mammalian carnivores. Anim. Conserv. 2024, 27, 585–599. DOI:10.1111/acv.12947 [Google Scholar]
- Mehran Anjum M. Pesticides and Environmental Health: A Review. Agric. Res. Technol. 2017, 5, 555671. DOI:10.19080/ARTOAJ.2017.05.555671 [Google Scholar]
- de Araujo LG, Zordan DF, Celzard A, Fierro V. Glyphosate uses, adverse effects and alternatives: Focus on the current scenario in Brazil. Environ. Geochem. Health 2023, 45, 9559–9582. DOI:10.1007/s10653-023-01763-w [Google Scholar]
- Gomes‐de‐Sá ÉFG, Ferreira GFDS, de Albuquerque ACF, Costa VA, Concone HVB, de Freitas NDA, et al. Conservation Blind Spots: Scenarios for Assessing the Exposure Risk of Brazilian Mammals to Pesticides. Mammal Rev. 2025, 55, 12386. DOI:10.1111/mam.12386 [Google Scholar]
- Jácome NL, Abarzua G, Astore V, Estrada Pacheco R. Mass poisonings of the Vulnerable Andean condor prompt national strategy against the use of toxic baits in Argentina. Ethnobiol. Conserv. 2022, 11, 14. DOI:10.15451/ec2022-07-11.14-1-17 [Google Scholar]
- DeMatteo KE, Rinas MA, Zurano JP, Selleski N, Schneider RG, Argüelles CF. Using niche-modelling and species-specific cost analyses to determine a multispecies corridor in a fragmented landscape. PLoS ONE 2017, 12, e0183648. DOI:10.1371/journal.pone.0183648 [Google Scholar]
- DeMatteo KE, Sotorres D, Escalante OM, Ibañez Alegre DM, Delgado PM, Rinas MA, et al. Integrating Species Distribution Models to Identify Overlapping Predator–Prey Conservation Priorities in Misiones, Argentina. Diversity 2025, 17, 748. DOI:10.3390/d17110748 [Google Scholar]
- Sotorres D. Identificación forense y análisis de distribución de especies presa a lo largo del corredor biológico propuesto para Misiones (Argentina). Bachelor’s Thesis, Universidad Nacional de Misiones, Facultad de Ciencias Exactas Químicas y Naturales, Posadas, Argentina, 2019. [Google Scholar]
- Sotorres D, Argüelles CF, Escalante OM, Rinas MA, DeMatteo KE. Integrating Land Use and Poaching Impacts for Sustainable Wildlife Management in the Atlantic Forest of Misiones, Argentina. Sustainability 2026, 18, 4329. DOI:10.3390/su18094329 [Google Scholar]
- Grogan LF, Berger L, Rose K, Grillo V, Cashins SD, Skerratt LF. Surveillance for Emerging Biodiversity Diseases of Wildlife. PLoS Pathog. 2014, 10, e1004015. DOI:10.1371/journal.ppat.1004015 [Google Scholar]
- Barroso P, Acevedo P, Vicente J. The importance of long‐term studies on wildlife diseases and their interfaces with humans and domestic animals: A review. Transbound. Emerg. Dis. 2021, 68, 1895–1909. DOI:10.1111/tbed.13916 [Google Scholar]
- DeMatteo KE, Rinas MA, Sede MM, Davenport B, Argüelles CF, Lovett K, et al. Detection Dogs: An Effective Technique for Bush Dog Surveys. J. Wildl. Manag. 2009, 73, 1436–1440. DOI:10.2193/2008-545 [Google Scholar]
- DeMatteo KE, Rinas MA, Argüelles CF, Holman BE, DI Bitetti MS, Davenport B, et al. Using detection dogs and genetic analyses of scat to expand knowledge and assist felid conservation in Misiones, Argentina. Integr. Zool. 2014, 9, 623–639. DOI:10.1111/1749-4877.12113 [Google Scholar]
- DeMatteo KE, Rinas MA, Argüelles CF, Zurano JP, Selleski N, Bitetti MSD, et al. Noninvasive techniques provide novel insights for the elusive bush dog (Speothos venaticus). Wildl. Soc. Bull. 2014, 38, 862–873. DOI:10.1002/wsb.474 [Google Scholar]
- Seljetun KO, Eliassen E, Madslien K, Viljugrein H, Vindenes V, Øiestad EL, et al. Prevalence of anticoagulant rodenticides in feces of wild red foxes (Vulpes vulpes) in norway. J. Wildl. Dis. 2019, 55, 834. DOI:10.7589/2019-01-027 [Google Scholar]
- Alasaad S, Permunian R, Gakuya F, Mutinda M, Soriguer RC, Rossi L. Sarcoptic-mange detector dogs used to identify infected animals during outbreaks in wildlife. BMC Vet. Res. 2012, 8, 110. DOI:10.1186/1746-6148-8-110 [Google Scholar]
- Galindo-Leal C, Câmara IG. The Atlantic Forest hotspot: An overview. In The Atlantic Forest of South America: Biodiversity, Status, Threats, and Outlooks (State of the Hotspots); Island Press: Washington, DC, USA, 2003. [Google Scholar]
- Vancine MH, Muylaert RL, Niebuhr BB, Oshima JEDF, Tonetti V, Bernardo R, et al. The Atlantic Forest of South America: Spatiotemporal dynamics of the vegetation and implications for conservation. Biol. Conserv. 2024, 291, 110499. DOI:10.1016/j.biocon.2024.110499 [Google Scholar]
- Izquierdo AE, De Angelo CD, Aide TM. Thirty Years of Human Demography and Land-Use Change in the Atlantic Forest of Misiones, Argentina: An Evaluation of the Forest Transition Model. Ecol. Soc. 2008, 13, 3. DOI:10.5751/ES-02377-130203 [Google Scholar]
- Izquierdo AE, Grau HR, Aide TM. Implications of Rural–Urban Migration for Conservation of the Atlantic Forest and Urban Growth in Misiones, Argentina (1970–2030). Ambio 2011, 40, 298–309. DOI:10.1007/s13280-010-0095-3 [Google Scholar]
- Paviolo A, De Angelo CD, Di Blanco YE, Di Bitetti MS. Jaguar Panthera onca population decline in the Upper Paraná Atlantic Forest of Argentina and Brazil. Oryx 2008, 42, 554–561. DOI:10.1017/S0030605308000641 [Google Scholar]
- De Angelo C, Paviolo A, Wiegand T, Kanagaraj R, Di Bitetti MS. Understanding species persistence for defining conservation actions: A management landscape for jaguars in the Atlantic Forest. Biol. Conserv. 2013, 159, 422–433. DOI:10.1016/j.biocon.2012.12.021 [Google Scholar]
- Di Bitetti MS, Paviolo A, Ferrari CA, De Angelo C, Di Blanco Y. Differential Responses to Hunting in Two Sympatric Species of Brocket Deer (Mazama americana and M. nana). Biotropica 2008, 40, 636–645. DOI:10.1111/j.1744-7429.2008.00413.x [Google Scholar]
- Crespo JA. Ecología de la comunidad de mamíferos del Parque Nacional Iguazú, Misiones. Revista del Museo Argentino de Ciencias Naturales, Ecología 1982, 3, 45–162. [Google Scholar]
- MapBiomas. MapBiomas Bosque Atlántico Trinacional—Collection 1 of the Annual Land Cover & Land Use Map Series for the Trinational Atlantic Forest. 2018. Available online: https://mapbiomas.org (accessed on 1 November 2020).
- Vynne C. Landscape Use by the Wide-Ranging Mammals of the Brazilian Cerrado. Ph.D. Dissertation, University of Washington, Seattle, WA, USA, 2010. Available online: https://search.proquest.com/docview/816087316 (accessed on 1 January 2013).
- Farrell LE, Roman J, Sunquist ME. Dietary separation of sympatric carnivores identified by molecular analysis of scats. Mol. Ecol. 2000, 9, 1583–1590. DOI:10.1046/j.1365-294x.2000.01037.x [Google Scholar]
- Miotto RA, Rodrigues FP, Ciocheti G, Galetti PM. Determination of the Minimum Population Size of Pumas (Puma concolor) Through Fecal DNA Analysis in Two Protected Cerrado Areas in the Brazilian Southeast. Biotropica 2007, 39, 647–654. DOI:10.1111/j.1744-7429.2007.00315.x [Google Scholar]
- Altschul SF, Gish W, Miller W, Myers EW, Lipman DJ. Basic local alignment search tool. J. Mol. Biol. 1990, 215, 403–410. DOI:10.1016/S0022-2836(05)80360-2 [Google Scholar]
- Menotti-Raymond MA, O’Brien SJ. Evolutionary Conservation of Ten Microsatellite Loci in Four Species of Felidae. J. Hered. 1995, 86, 319–322. DOI:10.1093/oxfordjournals.jhered.a111594 [Google Scholar]
- Menotti-Raymond M, David VA, Lyons LA, Schäffer AA, Tomlin JF, Hutton MK, et al. A Genetic Linkage Map of Microsatellites in the Domestic Cat (Felis catus). Genomics 1999, 57, 9–23. DOI:10.1006/geno.1999.5743 [Google Scholar]
- Carmichael LE, Clark W, Strobeck C. Development and characterization of microsatellite loci from lynx (Lynx canadensis), and their use in other felids. Mol. Ecol. 2000, 9, 2197–2199. DOI:10.1046/j.1365-294X.2000.105323.x [Google Scholar]
- Ernest HB, Penedo MCT, May BP, Syvanen M, Boyce WM. Molecular tracking of mountain lions in the Yosemite Valley region in California: Genetic analysis using microsatellites and faecal DNA. Mol. Ecol. 2000, 9, 433–441. DOI:10.1046/j.1365-294x.2000.00890.x [Google Scholar]
- Grisolia AB, Moreno F, Campagnari VR, Milazzotto MP, Garcia JF, Adania CH, et al. Genetic diversity of microsatellite loci in Leopardus pardalis, Leopardus wiedii and Leopardus tigrinus. Genet. Mol. Res. 2007, 6, 382–389. Available online: http://hdl.handle.net/11449/69875 (accessed on 1 January 2013).
- DeMatteo KE, Parker PG, Eggert LS. Characterization of dinucleotide microsatellite loci and confirmation of sexing primers for the bush dog (Speothos venaticus). Mol. Ecol. Resour. 2009, 9, 1219–1220. DOI:10.1111/j.1755-0998.2009.02603.x [Google Scholar]
- Hedmark E, Flagstad Ø, Segerström P, Persson J, Landa A, Ellegren H. DNA-Based Individual and Sex Identification from Wolverine (Gulo gulo) Faeces and Urine. Conserv. Genet. 2004, 5, 405–410. DOI:10.1023/B:COGE.0000031224.88778.f5 [Google Scholar]
- Waits LP, Luikart G, Taberlet P. Estimating the probability of identity among genotypes in natural populations: Cautions and guidelines. Mol. Ecol. 2001, 10, 249–256. DOI:10.1046/j.1365-294X.2001.01185.x [Google Scholar]
- Peakall R, Smouse PE. GENALEX 6: Genetic analysis in Excel. Population genetic software for teaching and research. Mol. Ecol. Notes 2006, 6, 288–295. DOI:10.1111/j.1471-8286.2005.01155.x [Google Scholar]
- Rice WR. Analyzing tables of statistical tests. Evolution 1989, 43, 223–225. DOI:10.1111/j.1558-5646.1989.tb04220.x [Google Scholar]
- Raymond M, Rousset F. GENEPOP (Version 1.2): Population Genetics Software for Exact Tests and Ecumenicism. J. Hered. 1995, 86, 248–249. DOI:10.1093/oxfordjournals.jhered.a111573 [Google Scholar]
- Van Oosterhout C, Hutchinson WF, Wills DPM, Shipley P. MICRO-CHECKER: Software for identifying and correcting genotyping errors in microsatellite data. Mol. Ecol. Notes 2004, 4, 535–538. DOI:10.1111/j.1471-8286.2004.00684.x [Google Scholar]
- Kalinowski ST. HP‐RARE 1.0: A computer program for performing rarefaction on measures of allelic richness. Mol. Ecol. Notes 2005, 5, 187–189. DOI:10.1111/j.1471-8286.2004.00845.x [Google Scholar]
- WorldPop, Center for International Earth Science Information Network (CIESIN), Columbia University. Global High Resolution Population Denominators Project; Funded by The Bill and Melinda Gates Foundation (OPP1134076); Columbia University: Palisades, NY, USA, 2018. DOI:10.5258/SOTON/WP00675 [Google Scholar]
- Sunquist M, Sunquist F. Puma. In Wild Cats of the World; University of Chicago Press: Chicago, IL, USA, 2002. [Google Scholar]
- Gonzalez‐Borrajo N, López‐Bao JV, Palomares F. Spatial ecology of jaguars, pumas, and ocelots: A review of the state of knowledge. Mammal Rev. 2017, 47, 62–75. DOI:10.1111/mam.12081 [Google Scholar]
- Kasper CB, Schneider A, Oliveira TG. Home range and density of three sympatric felids in the Southern Atlantic Forest, Brazil. Braz. J. Biol. 2016, 76, 228–232. DOI:10.1590/1519-6984.19414 [Google Scholar]
- HOT (Humanitarian OpenStreetMap Team)/OpenStreetMap Contributors. Argentina: Populated Places (OpenStreetMap Export). 2026. Available online: https://data.humdata.org/dataset/hotosm_arg_populated_places (accessed on 17 June 2026).
- DeMatteo KE, Blake LW, Young JK, Davenport B. How Behavior of Nontarget Species Affects Perceived Accuracy of Scat Detection Dog Surveys. Sci. Rep. 2018, 8, 13830. DOI:10.1038/s41598-018-32244-1 [Google Scholar]
- Vizcaychipi KA, Helou M, DeMatteo K, Macchiaroli N, Cucher M, Rosenzvit M, et al. Primera identificación de Echinococcus vogeli en una paca en la provincia de Misiones, Argentina. Rev. Argent. Microbiol. 2013, 45, 169–173. DOI:10.1016/S0325-7541(13)70020-8 [Google Scholar]
- Vizcaychipi KA, Irazú L, Rinas M, Argüelles C, González Prous C, Santillan G, et al. Fauna silvestre y parasitaria de la Selva Misionera un binomio zoonótico por resolver. Misiones, Argentina. Revista Argentina de Zoonosis y Enfermedades Infecciosas Emergentes 2015, 10, 29–32. Available online: http://www.aazoonosis.org.ar/wp-content/uploads/2013/05/Zoo-2015-2-completa-ok.pdf#page=310 (accessed on 1 January 2017).
- Vizcaychipi KA, Rinas M, Irazu L, Miyagi A, Argüelles CF, DeMatteo KE. Neotropical Zoonotic Parasites in Bush Dogs (Speothos venaticus) from Upper Paraná Atlantic Forests in Misiones, Argentina. Vector-Borne Zoonotic Dis. 2016, 16, 664–672. DOI:10.1089/vbz.2015.1929 [Google Scholar]
- Souza LSD, Sampaio R, Gomes APN, Morato RG, Chiarello AG, Souza LSD, et al. Occurrence of potential wild hosts of Echinococcus vogeli in the forests of southwestern Brazilian Amazonia. Biota Neotrop. 2022, 22, e20221365. DOI:10.1590/1676-0611-bn-2022-1365 [Google Scholar]
- Ali R, Nazeer S, Elahi MMS, Idu EG, Zhang H, Mahmoudvand H, et al. Global distribution and definitive host range of Echinococcus species and genotypes: A systematic review. Vet. Parasitol. 2024, 331, 110273. DOI:10.1016/j.vetpar.2024.110273 [Google Scholar]
- Ramos VN, Lemos FG, Azevedo FC, Arrais RC, Lima CFM, Candeias IZ, et al. Wild carnivores, domestic dogs and ticks: Shared parasitism in the Brazilian Cerrado. Parasitology 2020, 147, 689–698. DOI:10.1017/S0031182020000335 [Google Scholar]
- Riley SPD, Bromley C, Poppenga RH, Uzal FA, Whited L, Sauvajot RM. Anticoagulant Exposure and Notoedric Mange in Bobcats and Mountain Lions in Urban Southern California. J. Wildl. Manag. 2007, 71, 1874–1884. DOI:10.2193/2005-615 [Google Scholar]
- Serieys LEK, Armenta TC, Moriarty JG, Boydston EE, Lyren LM, Poppenga RH, et al. Anticoagulant rodenticides in urban bobcats: Exposure, risk factors and potential effects based on a 16-year study. Ecotoxicology 2015, 24, 844–862. DOI:10.1007/s10646-015-1429-5 [Google Scholar]
- Serieys LEK, Lea A, Epeldegui M, Foley J, Moriarty JG, Riley SPD, et al. Widespread Anticoagulant Poison Exposure is Linked with Immune Dysregulation and Severe Notoedric Mange in Urban Bobcats. In Proceedings of the Vertebrate Pest Conference; University of California, Davis: Davis, CA, USA, 2018; Volume 28. DOI:10.5070/V42811047 [Google Scholar]
- Serieys LEK, Lea AJ, Epeldegui M, Armenta TC, Moriarty J, VandeWoude S, et al. Urbanization and anticoagulant poisons promote immune dysfunction in bobcats. Proc. R. Soc. B 2018, 285, 20172533. DOI:10.1098/rspb.2017.2533 [Google Scholar]