
Analyzing the Impact of Riverbed Aggradation and Degradation on Flood Inundation Scenarios in an Ungauged River Using Hydrological and Hydraulic Model

Analyzing the Impact of Riverbed Aggradation and Degradation on Flood Inundation Scenarios in an Ungauged River Using Hydrological and Hydraulic Model
Received: 20 April 2026 Revised: 08 May 2026 Accepted: 29 June 2026 Published: 03 July 2026

© 2026 The authors. This is an open access article under the Creative Commons Attribution 4.0 International License (https://creativecommons.org/licenses/by/4.0/).
1. Introduction
1.1. Flood Problem and Motivation
The global population is experiencing significant growth, raising concerns about climate change and its impact on hydrological extremes. Extreme occurrences such as droughts and flooding are occurring in several regions of the Earth [1]. Flooding is one of the most prevalent and devastating natural disasters worldwide, causing loss of life, damage to infrastructure, and substantial economic disruption [2]. Floods represent a significant hazard due to their sudden onset and limited advance warning [3]. Nepal is particularly vulnerable to flood hazards due to its monsoon-dominated climate, rapid land-use changes, unplanned settlements, deforestation, and rugged mountainous topography, all of which contribute to increased flood susceptibility [4,5]. Recent events have further highlighted the severity of this challenge. During the September 2024 floods in Nepal, more than 249 people lost their lives, and over 5996 houses were completely damaged, resulting in significant socio-economic losses [6]. Such recurring flood events emphasize the necessity of accurate flood inundation mapping and hazard assessment to support disaster risk reduction, land-use planning, and sustainable river basin management [7].
1.2. Existing Methods
Hydrological and hydraulic models have been extensively applied to estimate flood magnitude, inundation extent, and flood hazards under different return-period events [8,9,10,11,12,13,14,15]. However, most conventional flood modeling approaches are based on static river geometry and assume that channel characteristics remain unchanged throughout the analysis period [16,17]. In reality, many alluvial rivers continuously experience aggradation (sediment deposition) and degradation (erosion), resulting in progressive modifications to channel morphology. These geomorphic changes can alter flow conveyance capacity, water surface elevations, and inundation patterns, potentially leading to significant errors in flood hazard estimation when they are ignored [18].
1.3. Research Gaps/Challenges
The challenge becomes even greater in ungauged basins, where continuous observations of discharge and sediment transport, as well as historical flood records, are unavailable [19]. Under such conditions, conventional flood assessment approaches become difficult to apply because both hydrological processes and riverbed evolution must be represented using limited data. Flood assessments commonly evaluate return-period events based on static channel geometry [20] and generally overlook the influence of long-term sediment-induced morphological changes [16]. Previous studies have shown that hydrological processes can be reasonably simulated in data-scarce environments using parameters derived from watershed characteristics and regional climatic information [21,22,23,24,25]. Nevertheless, the combined influence of riverbed aggradation and degradation on flood inundation and hazard characteristics remains insufficiently investigated, particularly in ungauged Himalayan river basins. This highlights how crucial it is to have an integrated modeling framework capable of simultaneously representing hydrological processes and riverbed dynamics under data-scarce conditions [26].
1.4. Selection of the Study Area
The Bakra River, located in Koshi Province of eastern Nepal, was selected as the study area because it represents a typical ungauged, sediment-prone river system in which flood hazards are strongly influenced by river morphology. The river originates in Miklajung Rural Municipality of Morang District and drains an area of approximately 60 km2. The basin receives nearly 2400 mm of annual rainfall, about 80% of which occurs during the monsoon season. In addition, the watershed is characterized by steep upstream terrain, highly erodible geological formations, and active sediment transport processes that promote continuous riverbed aggradation and degradation. Despite being exposed to recurrent flooding, the basin lacks continuous hydrological and sediment monitoring records, making it representative of many data-scarce Himalayan catchments [19]. These characteristics make the Bakra River an appropriate case study for investigating the influence of long-term riverbed morphological changes, riverbed aggradation, and degradation on flood inundation and hazard dynamics under ungauged conditions.
1.5. Research Objectives and Theoretical Background
Riverbed aggradation and degradation are fundamental geomorphological processes that occur when there is an imbalance between sediment supply and the sediment transport capacity of a river. According to sediment continuity principles, aggradation occurs when sediment inflow exceeds sediment outflow, causing deposition and an increase in bed elevation, whereas degradation occurs when sediment outflow exceeds sediment inflow, resulting in channel erosion and bed lowering. In sediment transport modeling, the difference between sediment influx and outflux is used to update channel geometry through adjustments in cross-sectional bed elevations. These morphological changes can significantly alter channel conveyance, flow depth, velocity distribution, water-surface elevation, and consequently, flood inundation behavior and hazard severity [20].
To investigate these interactions, this study integrates hydrological, hydraulic, and sediment transport modeling within a unified framework. The Soil and Water Assessment Tool (SWAT) is a semi-distributed, process-based model designed to simulate the effects of climate, land use, soil properties, and watershed management practices on runoff generation and sediment yield at the basin scale [27]. The Hydrologic Engineering Center River Analysis System (HEC-RAS), developed by the U.S. Army Corps of Engineers, is widely used for one-dimensional and two-dimensional hydraulic simulations, flood inundation mapping, sediment transport analysis, and channel morphology assessment [28]. The sediment module of HEC-RAS enables simulation of erosion, deposition, aggradation, and degradation processes, allowing long-term evaluation of riverbed evolution and its hydraulic implications.
The primary objective of this study is to evaluate the influence of long-term riverbed aggradation and degradation on flood inundation characteristics and flood hazard distribution in the ungauged Bakra River Basin. This study adopts an integrated SWAT–HEC-RAS modeling framework in which SWAT is used to simulate runoff and sediment yield, while HEC-RAS hydraulic and sediment transport models are applied to assess channel morphological evolution and associated flood behavior [26]. The framework is further employed to investigate how sediment-induced riverbed changes modify hydraulic characteristics, inundation extent, and flood hazard severity under different return-period flood events (Q2, Q25, Q50, and Q100) [29]. This integrated approach is particularly important for data-scarce river basins because it enables simultaneous representation of hydrological processes and riverbed dynamics, thereby providing a more realistic assessment of evolving flood risks than conventional approaches based on static channel geometry.
Specifically, this study aims to (i) simulate long-term runoff and sediment yield in the ungauged Bakra River Basin using SWAT through a donor-catchment parameter transfer approach; (ii) quantify riverbed aggradation and degradation using the HEC-RAS sediment transport model and evaluate resulting morphological changes; (iii) assess flood inundation extent, flow characteristics, and hazard distribution for different return-period flood events; and (iv) compare hydraulic and hazard responses between the original and morphologically altered channel geometries to determine the influence of riverbed evolution on flood behavior and flood risk.
1.6. Contributions of the Study
The major findings and major contributions of this study can be summarized as follows:
-
-
An integrated SWAT–HEC-RAS framework was developed to simulate hydrological, hydraulic, and sediment transport processes in an ungauged river basin.
-
-
A donor-catchment approach was successfully applied to transfer calibrated hydrological parameters from the Kankai River Basin to the ungauged Bakra River Basin.
-
-
Long-term sediment simulations revealed substantial riverbed evolution, with maximum aggradation of approximately +2.1 m and degradation of approximately −4.0 m over a 41-year period.
-
-
Riverbed morphological changes significantly altered hydraulic behavior, including flow velocity distribution and water surface profiles.
-
-
Although the total inundation area decreased after incorporating riverbed evolution, the extent of very high flood hazard zones increased by approximately three to five times compared with the static-channel scenario.
-
-
The results demonstrate that conventional flood assessments based on static river geometry may underestimate localized flood hazards in sediment-dominated rivers.
The remainder of this paper is organized as follows. Section 2 reviews previous studies related to hydrological modelling, hydraulic simulation, sediment transport processes, flood inundation mapping, and flood hazard assessment. Section 3 describes the study area, datasets, and methodological framework adopted for hydrological, hydraulic, and sediment modeling. Section 4 presents and discusses the results of hydrological calibration and validation, sediment transport simulation, riverbed morphological changes, hydraulic analysis, flood inundation mapping, and flood hazard assessment. Finally, Section 5 summarizes the major findings of the study, highlights its limitations, and provides recommendations for future research and flood risk management in sediment-prone ungauged river basins.
2. Literature Review
Riverbed dynamics, including degradation, aggradation, and their interaction with flood inundation, are crucial areas for effective flood management, especially in ungauged basins. Coupling of hydrological models like SWAT and hydrodynamic models like HEC-RAS has contributed substantially to the simulation of these complex interactions. The Soil and Water Assessment Tool (SWAT) is a semi-distributed, process-based model developed to simulate the impact of land use, climate, and management practices on hydrology and sediment transport at the watershed scale. The Soil and Water Assessment Tool (SWAT) is widely used to simulate watershed hydrology and sediment transport. For example, Ali et al. [30] applied the SWAT model to the Swat River basin in Pakistan to demonstrate its effectiveness in forecasting sedimentation patterns, which are critical factors influencing flood risks. Zhang et al. [31] used SWAT to model sediment yield in the Loess Plateau, China, demonstrating that SWAT captured seasonal variations in sediment yield effectively. HEC-RAS, in its 1D and 2D capabilities, has been thoroughly applied to floodplain mapping and simulation of flood situations. The Hydrologic Engineering Center River Analysis System (HEC-RAS) is a widely used hydraulic modeling software developed by the U.S. Army Corps of Engineers for simulating river hydraulics, water surface profiles, sediment transport, and floodplain inundation. The model supports both one-dimensional (1D) and two-dimensional (2D) flow simulations and incorporates sediment transport and mobile-bed computation modules for analyzing long-term river morphological changes. Owing to its flexibility and capability to represent complex hydraulic processes, HEC-RAS has been extensively applied in flood inundation mapping, sediment transport analysis, and flood hazard assessment studies worldwide [HEC-RAS Hydraulic Reference Manual; HEC-RAS Sediment Transport Manual]. Upadhyaya et al. [14] in Nepal employed HEC-RAS to simulate flood risks in the Paharia Khola, revealing its utility in mapping flood-risk areas. Adhikari et al. [32] also employed HEC-RAS for extreme flood analysis in the Chamelia River Basin, revealing its utility in flood hazard mapping. The research conducted by Asitatikie et al. [33] emphasized the model’s capability to simulate water surface profiles and inundation areas accurately, even with limited input data. Thiaw et al. [34] introduced SUFI-2, which provides uncertainty ranges and improves model robustness in data-scarce regions. The integration of hydrological models, such as SWAT, with hydrodynamic models, such as HEC-RAS, enables comprehensive simulation of sediment transport and its impact on flooding. Ali et al. [30] utilized SWAT and HEC-RAS to model sediment transport and river siltation in the Swat River basin, demonstrating the effectiveness of this coupled approach in predicting flood potential. Additionally, the Gridded Surface Subsurface Hydrologic Analysis (GSSHA) model offers two-dimensional physically based simulations of surface water, groundwater hydrology, erosion, and sediment transport, providing useful information about watershed dynamics. Dahal et al. [35] used SWAT in the Karnali River; model calibration and validation were performed using observed peak discharge data, demonstrating the model’s satisfactory performance for further simulations.
In ungauged basins, it is especially difficult to make estimates of flood extents due to a lack of observed data. Basnet et al. [19] were able to overcome this using the Catchment Area Ratio approach coupled with HEC-RAS for floodplain mapping of the ungauged Seti River in Pokhara, Nepal, and demonstrating successful approaches in data poor regions. A study conducted by Jha et al. [36] in the Blue River Watershed, Kansas City, utilized SWAT to generate runoff inputs for HEC-RAS, enabling detailed flood inundation mapping despite limited observational data. The combined modeling approach facilitated the assessment of various land use and climate change scenarios on flood risks. Bhattarai et al. [37] conducted flood inundation mapping of the Babai Basin using HEC-RAS and GIS, providing insights into flood extents for different return periods. Pandit et al. [9] utilized HEC-RAS 2D modeling for flood risk mapping of the Kamla River Basin, assessing hazard levels and vulnerabilities. Nepal et al. [38] performed flood inundation mapping of the Bagmati River and assessed impacts on building infrastructure in the Terai plains, aiding land-use zoning and flood risk mitigation. Basnet et al. [8] analyzed flooding in the Ramghat area of Pokhara using HEC-RAS and prepared floodplain maps for planning and disaster risk management. While studies directly linking riverbed aggradation and degradation with flood inundation are limited, the impact of sedimentation on flood hazards is acknowledged. Ali et al. [30] state that sedimentation results in buildup in rivers, leading to silting of the channel and increasing its susceptibility to floods. This further emphasizes the importance of considering riverbed change in flood modeling. Riverbed aggradation (upbuilding) and degradation (downcutting) occur due to an imbalance between sediment supply and the river’s transport capacity. These processes can significantly alter channel capacity and flow conveyance, directly influencing the extent and depth of flooding. In the Himalayan foothills, for example, dynamic patterns of sediment deposition and erosion have been well documented, with seasonal floods frequently reshaping riverbeds. Similarly, in the Luohe River, flood events have been shown to trigger large-scale scouring and sediment deposition, leading to substantial changes in channel morphology and overall river stability [31]. A scoping review by Hamidifar et al. [39] highlights that sediment transport plays a crucial role in influencing the flood process, causing a decoupling of water level fluctuations and flow, thereby impacts flood hazard assessments. A systematic review by Andualem et al. [40] evaluates soil erosion and sediment transport models, recommending tools like the Soil and Water Assessment Tool (SWAT) and the Automated Geospatial Watershed Assessment Tool (AGWA) for catchment-scale applications. These models account for spatial variations in erosion potential and sediment yield, aiding in effective flood risk management. Sediment deposition can reduce channel capacity, increasing flood risk, while erosion can alter flow paths. Advanced modeling approaches that integrate sediment dynamics enable better prediction of flood extents and support the development of effective flood mitigation strategies [41].
3. Materials and Methods
This section outlines the study area characteristics, data sources, modeling approaches, and analytical methods employed to assess the impact of long-term river morphological evolution on flood inundation within the Bakra River Basin. Section 3.1 provides an overview of the basin’s geographical setting, climatic conditions, topography, and geological features, which govern the hydrological and sediment transport processes occurring in the watershed. Section 3.2 details the datasets, model configurations, and methodological procedures applied for hydrological, hydraulic, sediment transport, and flood hazard analyses. Collectively, these components establish a comprehensive framework for examining the relationships among watershed hydrology, sediment dynamics, channel adjustments, and flood hazard characteristics.
3.1. Study Area
The study was conducted in the Bakara River basin located in the eastern part of Nepal. The upstream part of the study area is located between 26°75′44″ N to 87°65′26″ E and 26°42′56″ N to 87°37′36″ E. The basin has a total area of 60,500,000 m2. The elevation of the basin varies between low 202 m to High 2381 m. Bakra River originates in the northern part of the Morang district of Miklajung VDC, Nepal. Average annual rainfall is about 2400 mm (nearly eighty percent occurs during monsoon [June–September]). The river is largely dry during the non-monsoon [October–May] period. Temperature in the basin ranges from around 10 °C in winter to above 35 °C in summer, which also influences evaporation, soil moisture, and agricultural practices. These climatic conditions are essential factors for hydrological and sediment modeling.
Access to the region is moderately feasible. The East-West Highway and a network of rural roads provide access to the lower catchment, while the upper reaches, located in more rugged terrain, are accessible mainly via foot trails and limited road infrastructure. The upper basin is marked by steep, forest-covered hills, while the lower basin features gently sloping alluvial plains. This topographic transition plays a crucial role in influencing both runoff generation and sediment transport. The river follows a dendritic drainage pattern, which suggests a uniform geological structure and the presence of substantial surface runoff. Geologically, the basin is located within the Siwalik zone of the Lesser Himalayas. The upper catchment is composed primarily of sandstone, siltstone, and conglomerates, which are highly erosion-prone and contribute significantly to sediment yield during intense rainfall events. In contrast, the southern plains are made up of unconsolidated alluvial deposits, including clay, silt, and sand, which, while fertile, are also highly susceptible to erosion. The study area is shown in Figure 1.
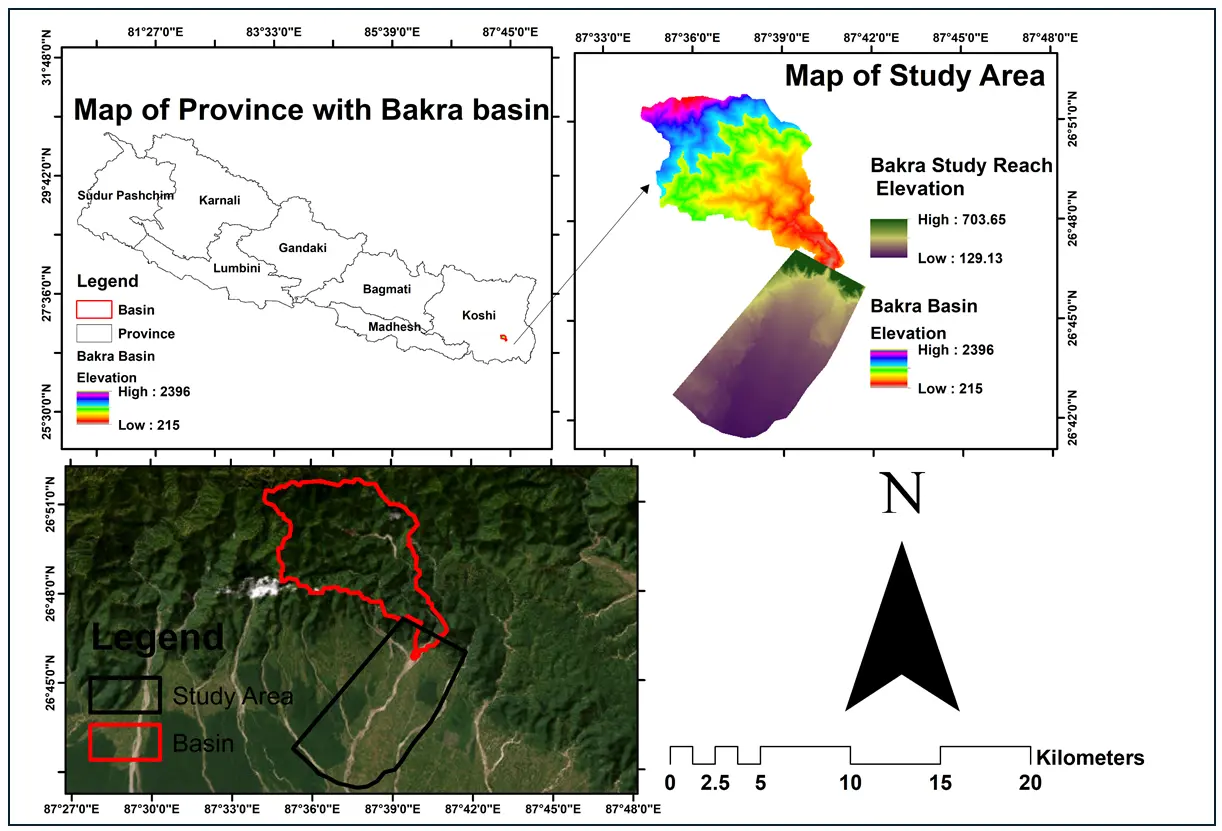
Figure 1. Geographic location of the Bakra River Basin in Koshi Province, Nepal, together with the study reach and basin topography derived from DEM and Google satellite data. The left panel shows the basin location within the province, while the right panel presents the basin boundary, study reach, and elevation variation, and the bottom panel shows study reach along with the basin in a Google satellite background.
3.2. Data and Methods
This section presents the datasets, modeling framework, and analytical procedures adopted to investigate hydrological processes, channel morphological evolution, and flood hazards in the Bakra River Basin. The methodology comprises two interconnected components: (i) SWAT-based hydrological modelling, including donor-catchment calibration, parameter transfer, and simulation of long-term streamflow and sediment yield for the ungauged basin; and (ii) HEC-RAS-based hydraulic, sediment transport, and flood hazard analyses, which utilize the hydrological outputs as model inputs. Spatial and hydrometeorological datasets obtained from national and international sources were processed within a GIS environment prior to model implementation, while the principal spatial datasets used for watershed delineation, terrain analysis, hydraulic terrain generation, and Hydrologic Response Unit (HRU) development in both the donor Kankai Basin and the study Bakra Basin are summarized in Table 1.
All spatial datasets were projected into a common coordinate reference system (WGS 84/UTM Zone 45N) to ensure spatial consistency during hydrological and hydraulic analyses. DEM datasets were referenced to the EGM96 vertical datum. The SRTM DEM obtained from USGS Earth Explorer has a reported vertical accuracy of approximately ±16 m, while the ICIMOD land use dataset has an overall classification accuracy exceeding 90%. Soil datasets obtained from the Nepal Agricultural Research Council (NAARC) follow standard national soil survey classification and mapping practices. Standard preprocessing operations, including sink filling, clipping, reprojection, raster resampling, polygon-to-raster conversion, and attribute harmonization, were performed in ArcGIS prior to model implementation.
Hydrological simulations and parameter optimization were carried out using SWAT and SWAT-CUP, whereas hydraulic and sediment transport simulations were conducted using HEC-RAS version 6.5. The spatial datasets used for hydrological model development, including DEM, land use/land cover, and soil distributions for both the donor Kankai Basin and the study Bakra Basin, are presented in Figure 2. Similarities in dominant land use and soil characteristics between the two basins supported the application of the donor-catchment approach to transfer hydrological parameters. The meteorological stations, hydrological observation stations, climatological datasets, and observation periods used for model calibration and simulation are presented in Figure 3.
Table 1. Summary of spatial datasets used for hydrological analysis in the donor (Kankai) and study (Bakra) basins.
|
Dataset |
Source |
Resolution/Scale |
Dataset Type |
Year |
Format |
Spatial Extent |
Purpose |
|---|---|---|---|---|---|---|---|
|
DEM |
USGS Earth Explorer (SRTM) |
30 m (resampled to 90 m where required) |
Elevation model |
2022 |
Raster |
Entire basin |
Watershed delineation and terrain analysis |
|
Land Use/Land Cover |
ICIMOD |
30 m |
Satellite-derived land cover |
2022 |
Raster |
Study watershed |
HRU generation |
|
Soil Map |
NAARC |
Polygon scale |
Soil survey dataset |
— |
Vector |
Study watershed |
Hydrologic soil group and soil texture assignment |
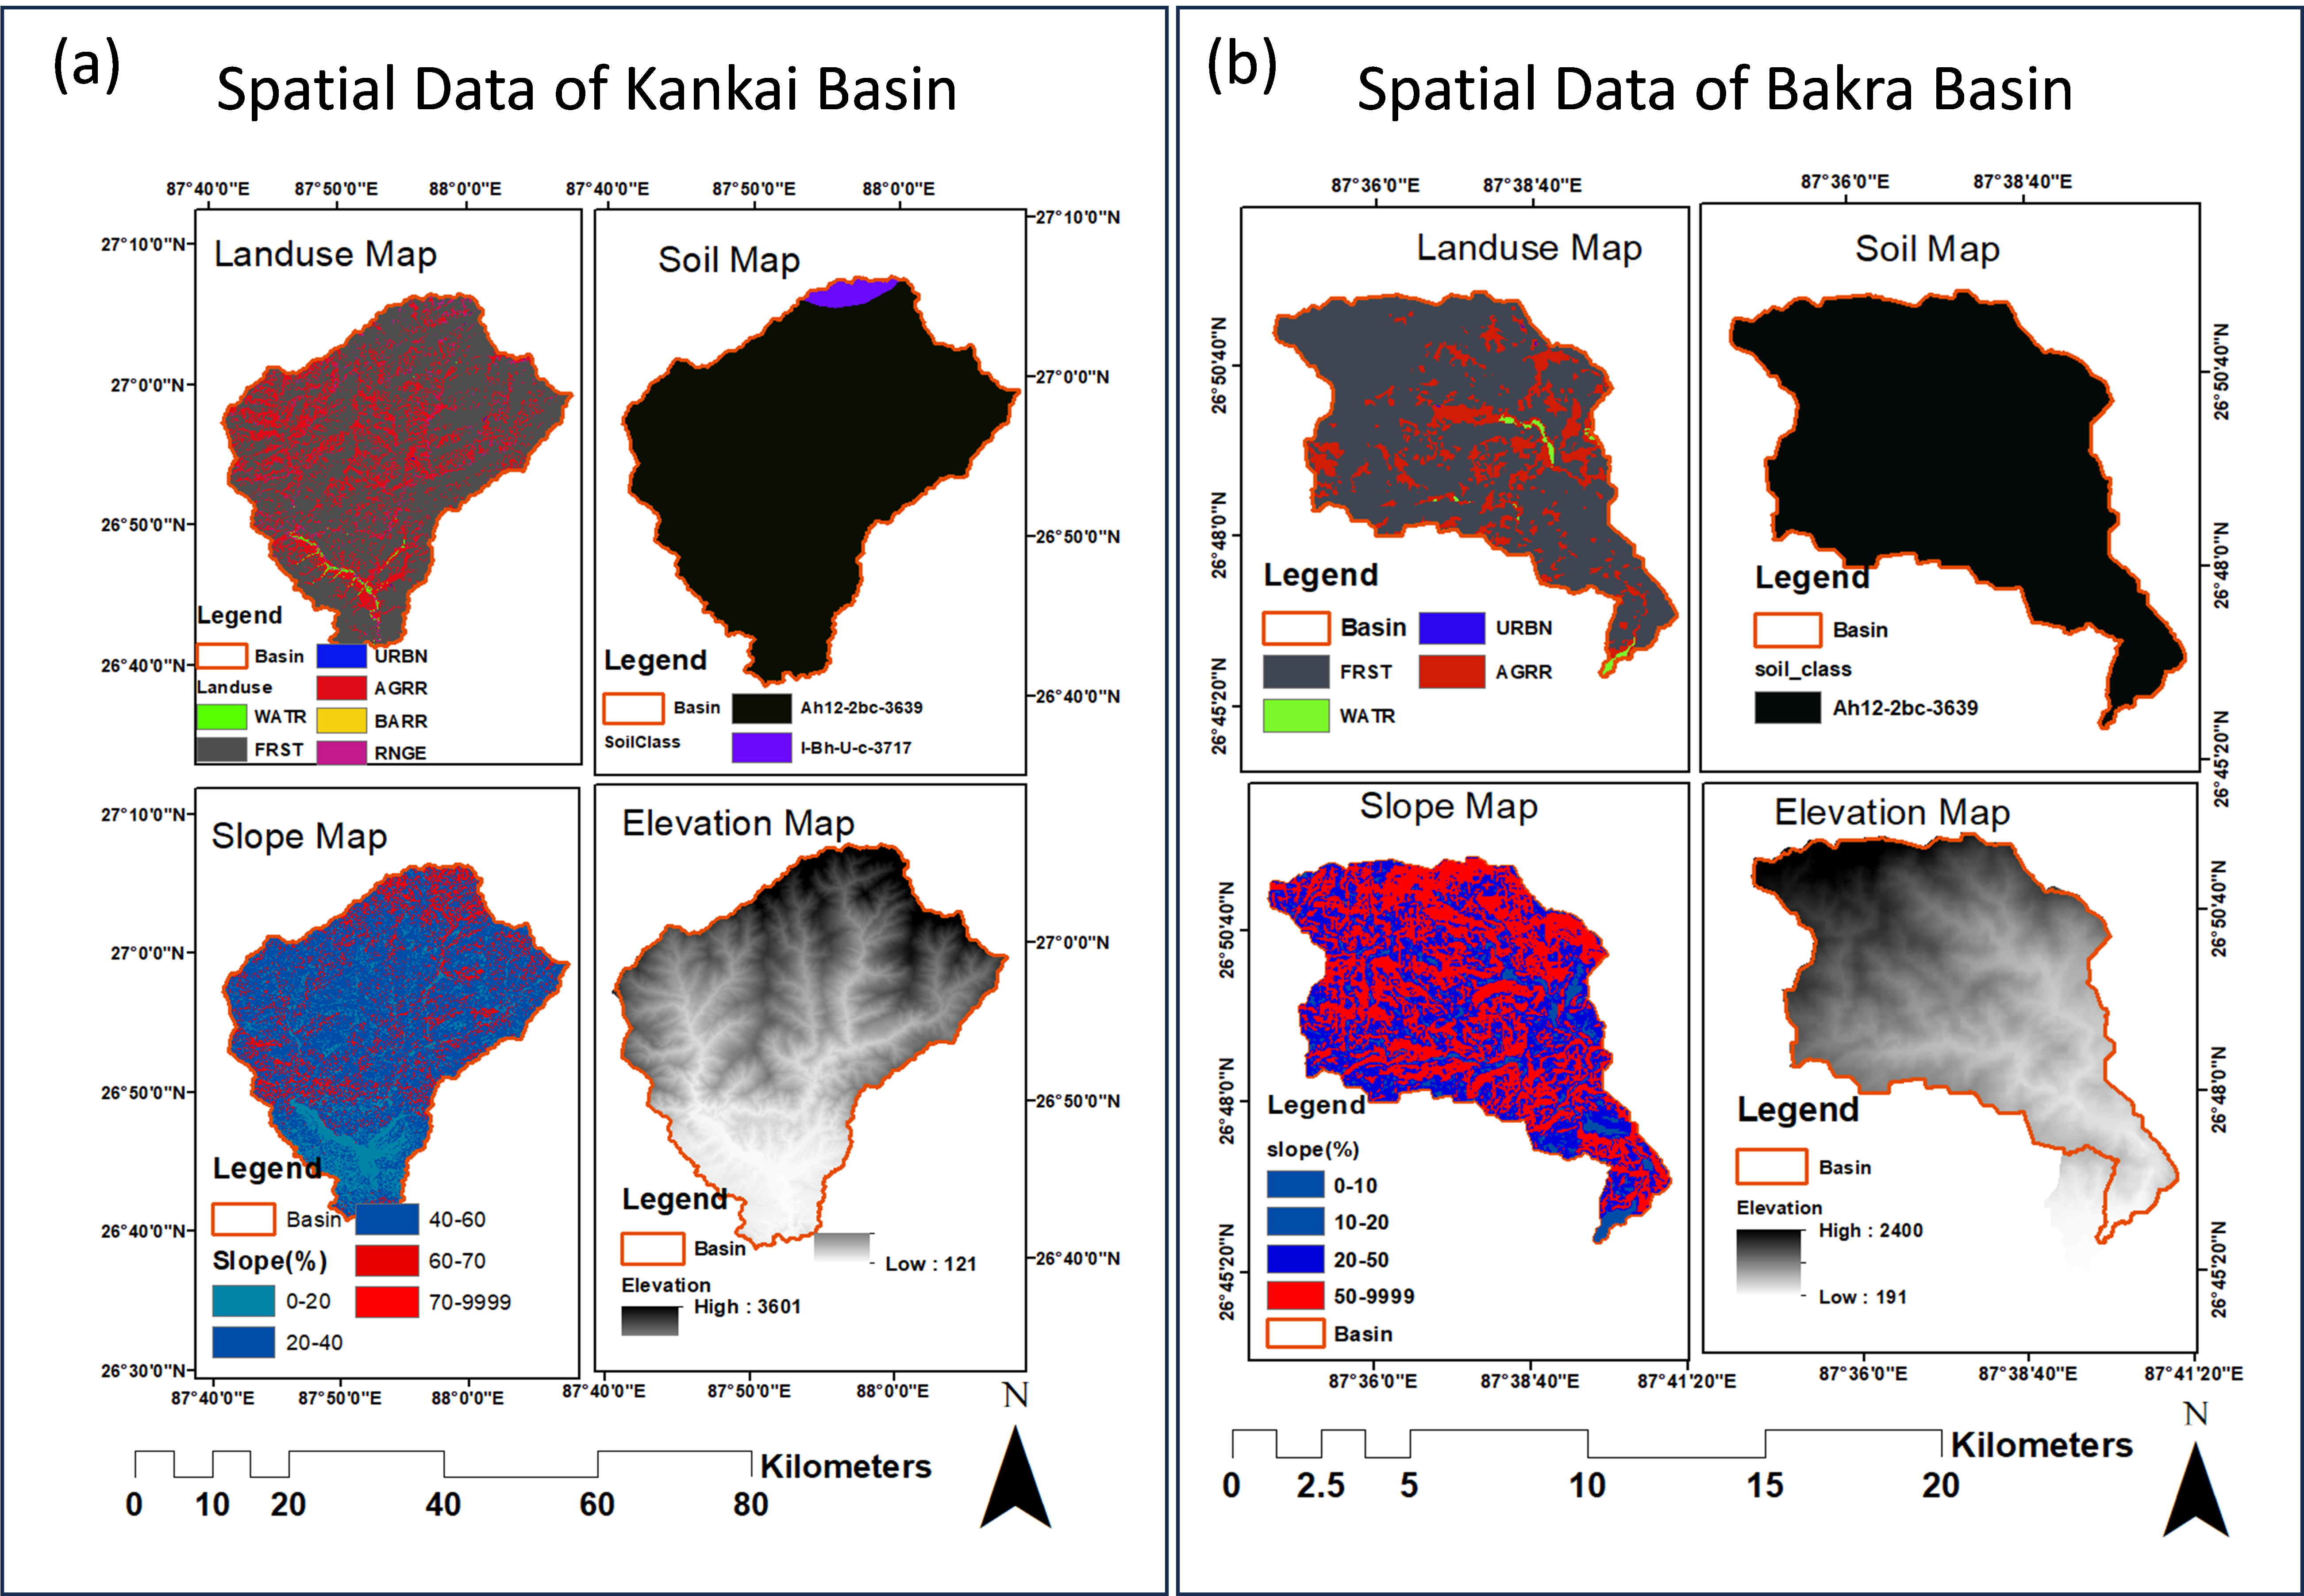
Figure 2. Spatial datasets used in the (a) Donor Kankai Basin and (b) Study Bakra Basin, including DEM, land use/land cover, and soil maps land use classes include FRST (forest), AGRR (agriculture land), URBN (urban area), RNGE (rangeland/grassland), BARR (barren land), WATR (water bodies).
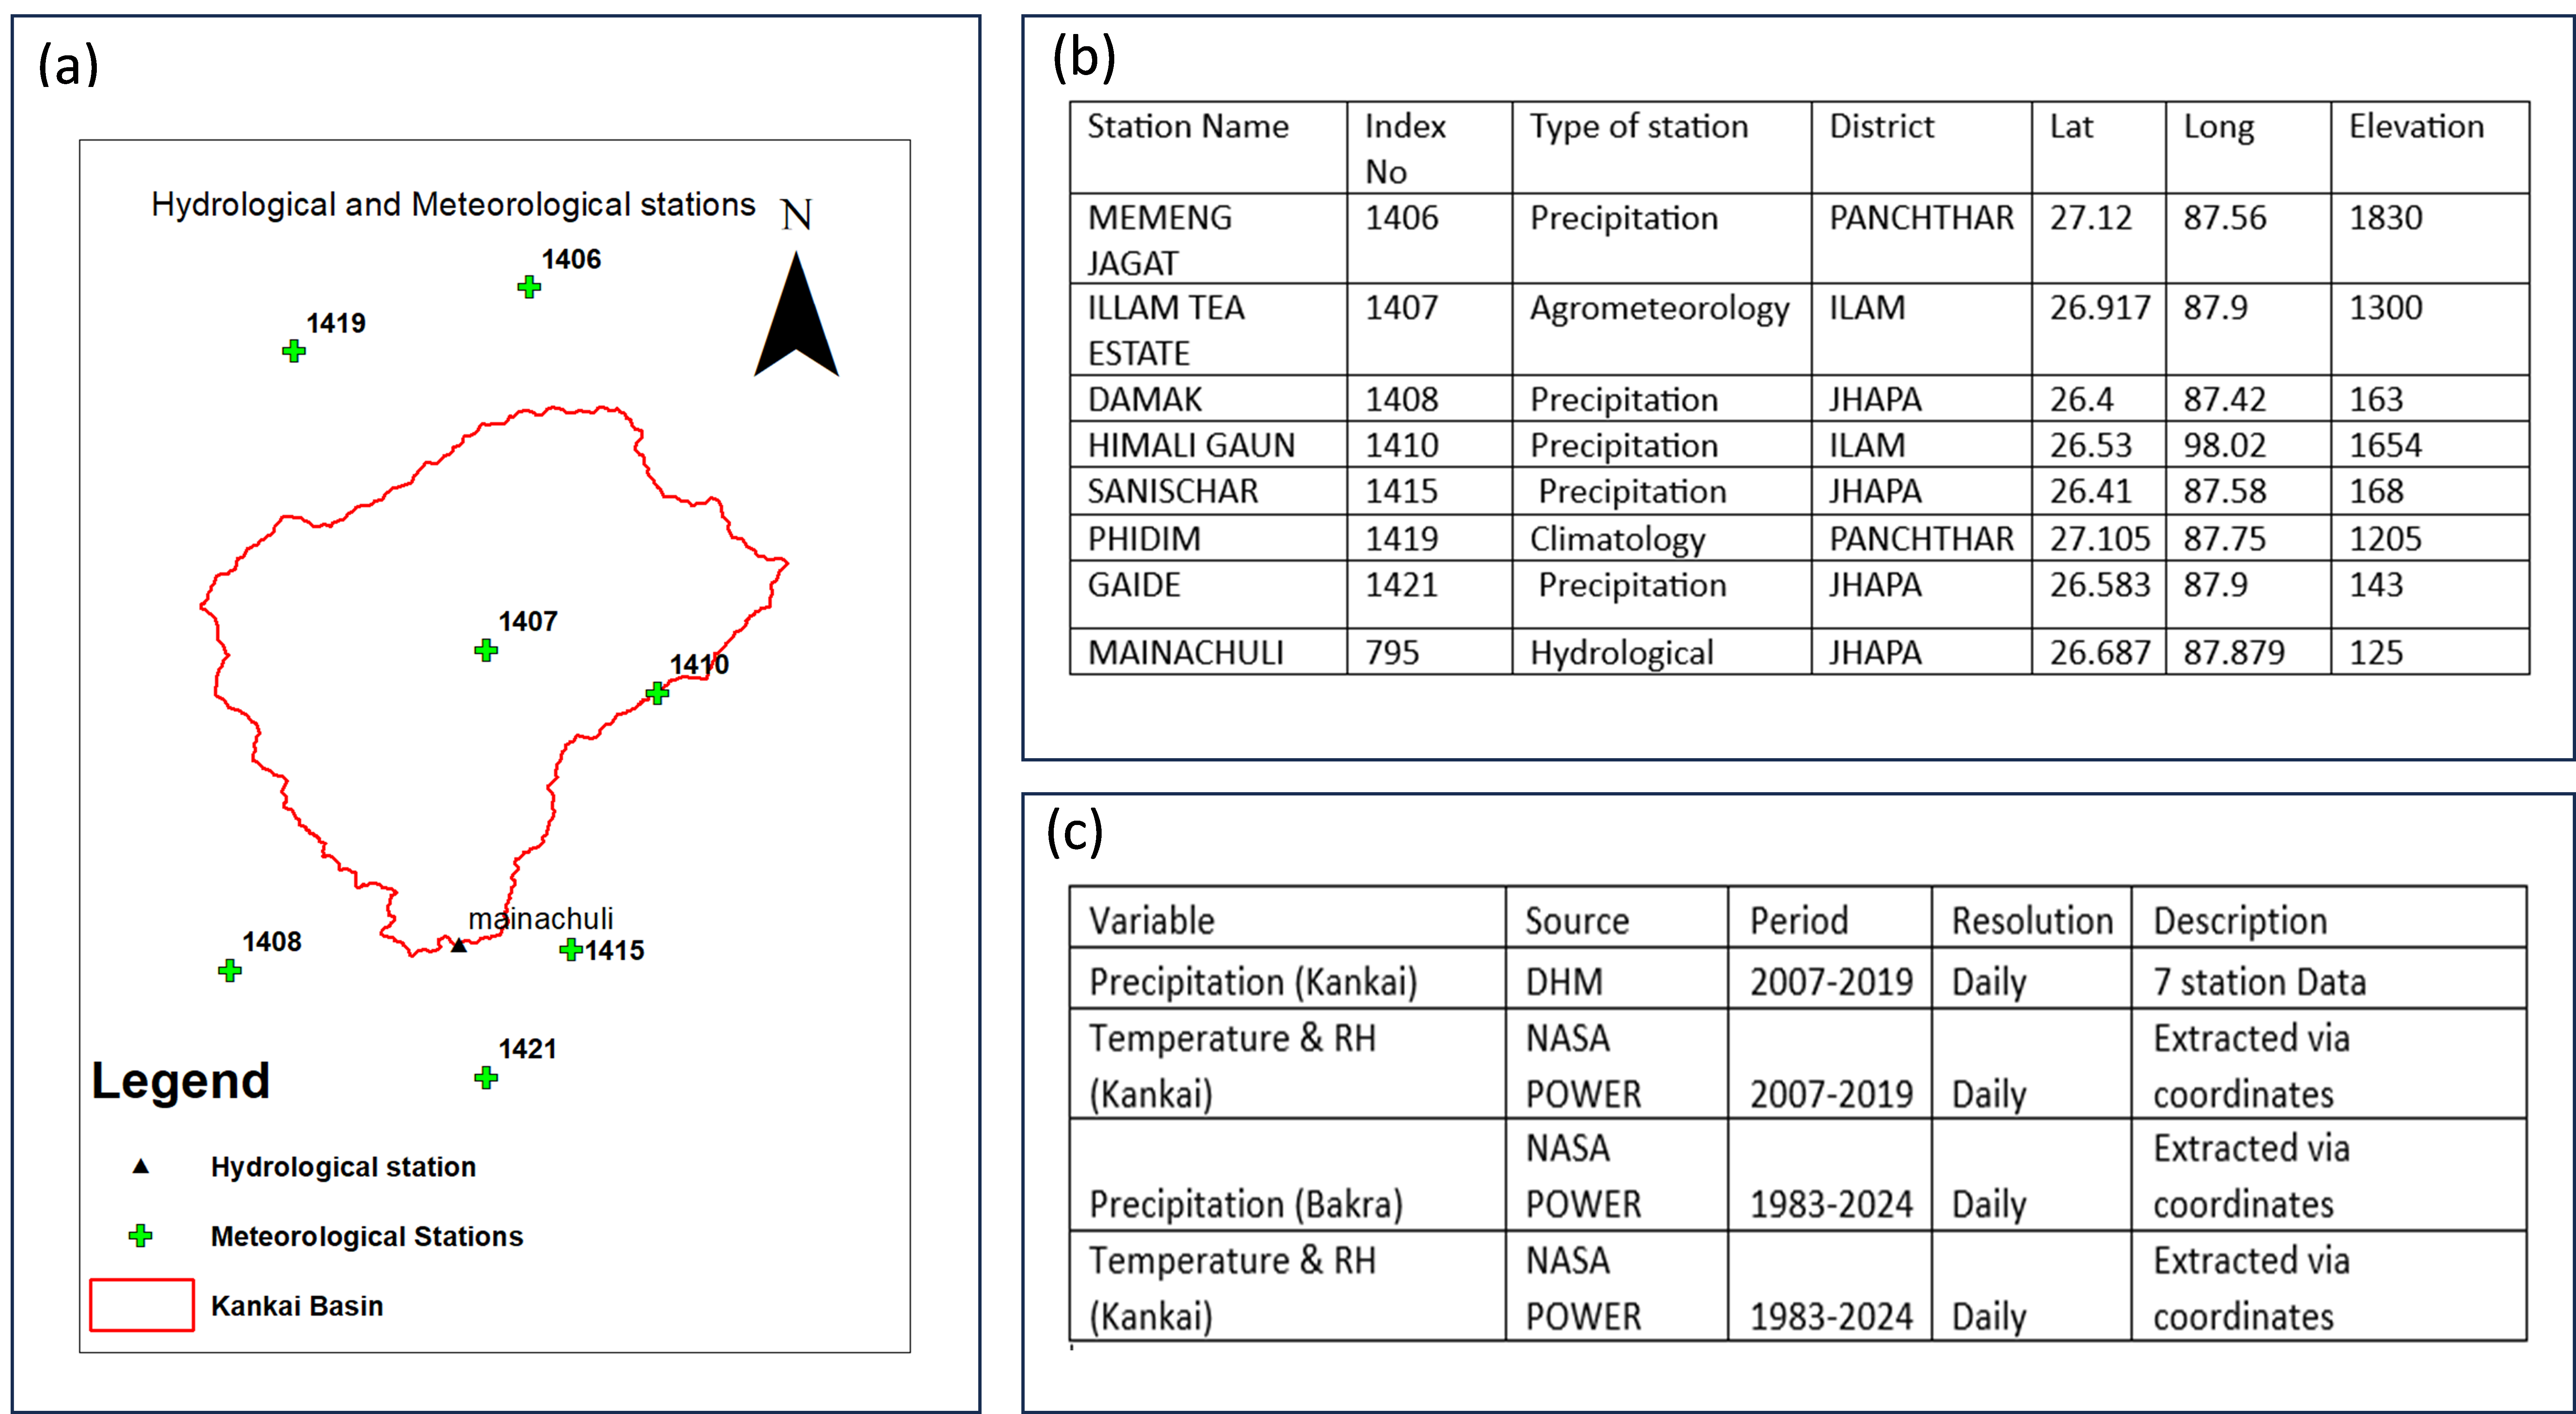
Figure 3. (a) Map view of meteorological and hydrological stations used in the Kankai Basin. (b) Summary of Tabular representation of meteorological and hydrological stations used in Kankai Basin. (c) Summary of climatological dataset used and climatological period in both Kankai and Bakra basins.
The overall workflow adopted for hydrological modeling, hydraulic simulation, sediment transport analysis, and flood hazard assessment is illustrated in Figure 4 and Figure 5.
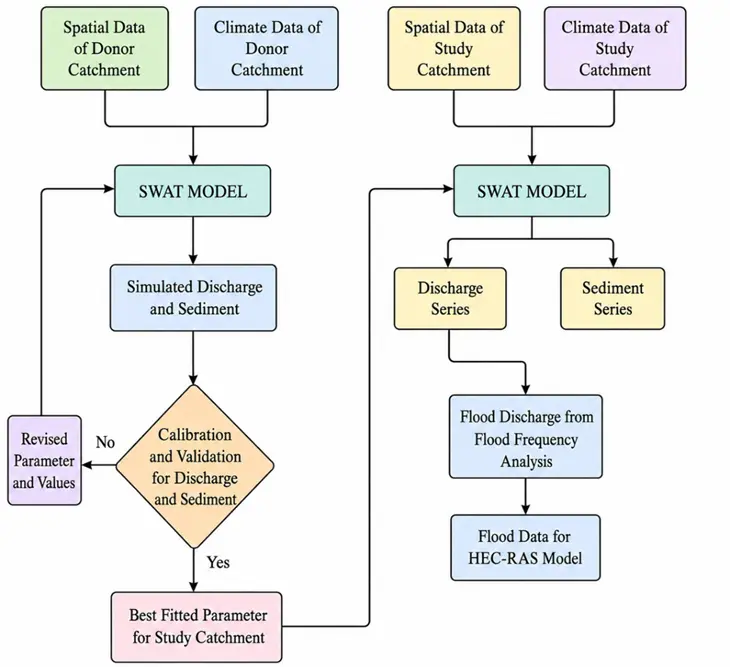
Figure 4. Workflow Diagram adopted for SWAT-based hydrological modeling, donor-catchment calibration, parameter transfer, and runoff-sediment simulation.
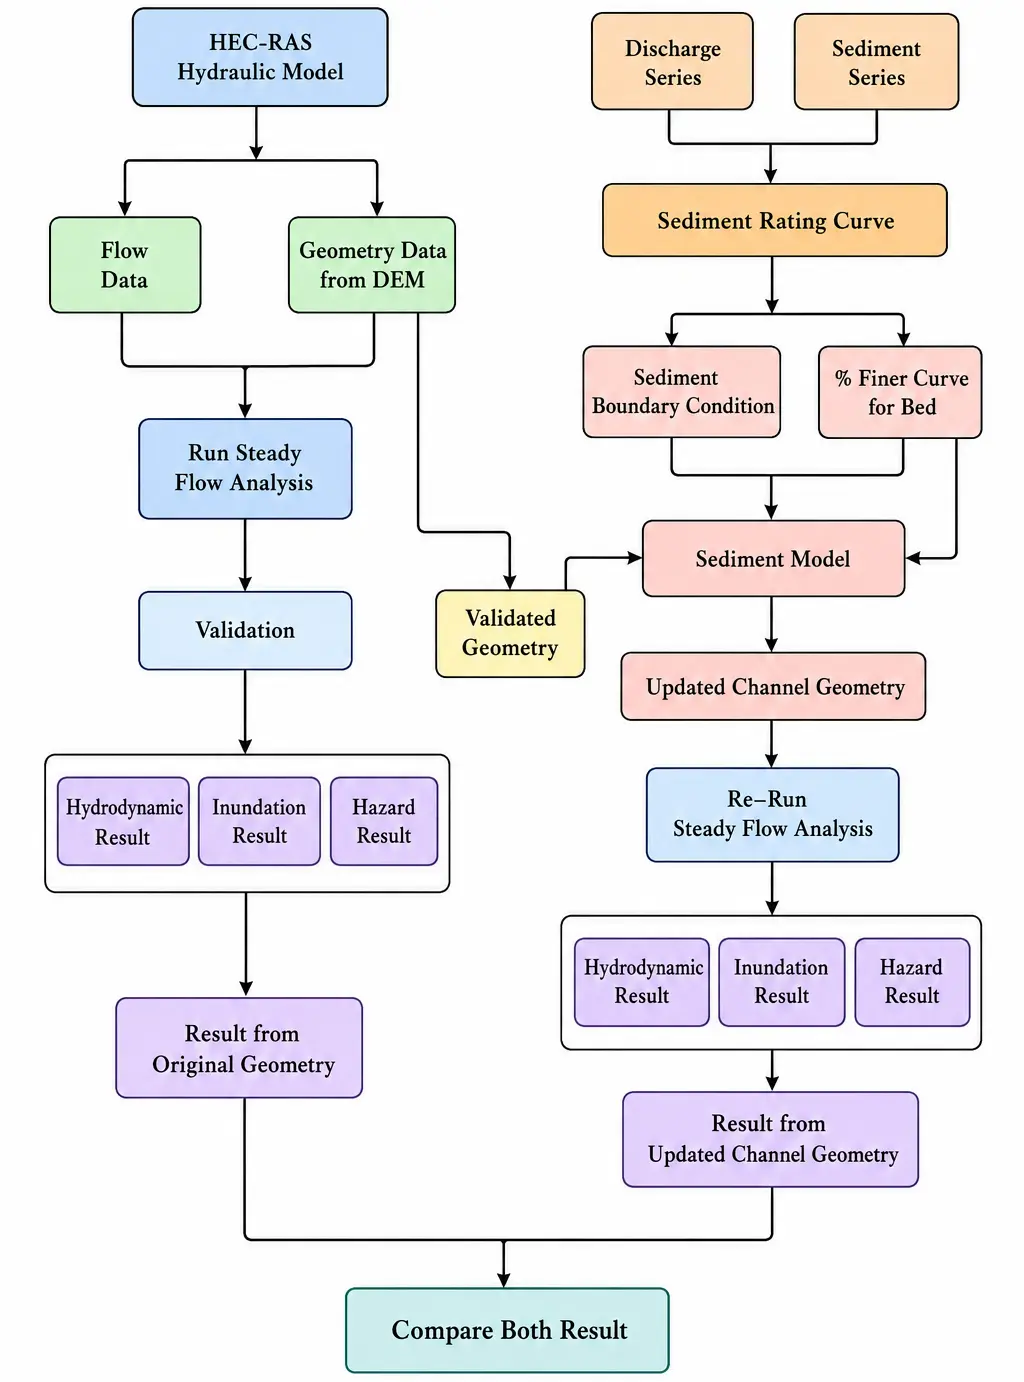
Figure 5. Workflow Diagram Adopted for Hydraulic and Sediment Modeling, updating channel geometry and Comparative flood hazard assessment Using HEC-RAS.
3.2.1. Hydrological Analysis
Hydrological simulations were performed using the Soil and Water Assessment Tool (SWAT) to estimate streamflow and sediment yield in the ungauged Bakra River Basin. Due to no observed hydrological records in the study basin, a donor-catchment approach was adopted in which calibrated hydrological parameters from the hydrologically similar Kankai Basin were transferred to the Bakra Basin. The overall workflow diagram adopted for donor basin calibration, parameter transfer, and hydrological simulation is illustrated in Figure 4.
The workflow diagram presented in Figure 4 is described as follows. It begins with the preparation of (a) spatial datasets summarized in Table 1 and illustrated in Figure 2, (b) preparation of climate data as described in Figure 3, (c) SWAT model setup and run in the donor catchment, (d) Selecting the best fitted parameter based on calibration and validation on the donor catchment followed by the preparation of (e) SWAT model setup and run in study catchment, and (f) flood discharge for various flood events from flood frequency analysis.
- (a)
-
Spatial Data: The donor (Kankai) basin was delineated using a 90 m DEM derived from the Shuttle Radar Topography Mission (SRTM) dataset obtained from USGS Earth Explorer. Basin elevation ranges from 121 m to 3601 m. Land use data obtained from ICIMOD for the year 2022 were reclassified into SWAT-compatible classes, including FRST (forest), AGRR (agriculture), URBN (urban area), RNGE (grassland), BARR (barren land), and WATR (water bodies). Soil data were obtained from the NAARC repository and clipped to the Kankai watershed boundary. Based on the NSORTER classification, two dominant soil types were identified. The soil input file for SWAT was prepared by assigning appropriate texture, hydrologic group, and other parameters to each class.
- (b)
-
Climate Data: Daily rainfall data from seven DHM meteorological stations for the period 2007–2019, together with temperature and humidity data obtained from NASA POWER, were used as climatic inputs for the donor basin model, where a 3-year warm-up period (2007–2009) was applied to stabilize the model before the calibration period. The locations of meteorological stations used in the hydrological analysis are shown in Figure 3. A lookup table in SWAT format was created containing station names, latitudes, longitudes, and elevations. The Kankai Basin was subdivided into 63 sub-basins and 507 Hydrologic Response Units (HRUs) using a 10% threshold for land use, soil, and slope classes.
- (c)
-
SWAT Model Setup and Run in Donor Catchment: The SWAT model for the donor Kankai River Basin was developed using spatial and climatic datasets integrated within the ARCSWAT environment. Watershed delineation was performed using a processed Shuttle Radar Topography Mission (SRTM) DEM, which identified 63 sub-basins with the primary outlet located at the DHM gauging station (795) Mainachuli, as shown in Figure 3. Flow direction and flow accumulation grids derived from the DEM were used to define the drainage network and stream pathways within the basin. Hydrologic Response Units (HRUs) were generated through the overlay of land use/land cover, soil, and slope datasets. Slope classes were automatically generated within ARCSWAT, and threshold values of 10% were applied for land use, soil, and slope to reduce computational complexity while preserving watershed heterogeneity. The final model configuration produced 507 HRUs representing distinct hydrological response characteristics within the basin. All spatial datasets were linked to the SWAT database, and daily climatic inputs, including precipitation, temperature, and humidity, were incorporated in text format prior to model execution. The delineated catchment covered an area of approximately 1155 km2, and the model simulation period extended from 2007 to 2019, producing daily outputs for streamflow and sediment yield at sub-basin and watershed outlet scales. Initial model execution was performed using default parameter values based on land use and soil characteristics. The model executed successfully without numerical instability and generated continuous daily hydrological and sediment outputs. This initial setup provided the basis for subsequent calibration and validation procedures carried out using SWAT-CUP.
- (d)
-
Calibration, Validation, Sediment Simulation, and Parameter Transfer: Calibration and validation of the SWAT model for the donor Kankai River Basin were performed using observed daily discharge records from the Mainachuli (st795) gauging station. The model was calibrated for the period 2010–2014 and validated for 2015–2019, while a three-year warm-up period (2007–2009) was applied to minimize the influence of initial conditions and stabilize model processes. A sensitivity analysis was conducted in SWAT-CUP to identify the most influential hydrological parameters governing streamflow response within the basin. Model calibration was carried out using the SUFI-2 algorithm implemented in SWAT-CUP. Four iterative calibration cycles consisting of 500 simulations each were performed, and parameter ranges were progressively refined to improve simulation accuracy and reduce uncertainty. Model performance was evaluated using Nash–Sutcliffe Efficiency (NSE), coefficient of determination (R2), and Percent Bias (PBIAS), together with graphical assessment using dotty plots and 95% prediction uncertainty (95PPU) bands. The final set of calibrated parameters, established by the agreement between simulated and observed discharge during the calibration period, was subsequently applied to the validation period without any additional parameter modifications to evaluate the model’s robustness and predictive capability. Model performance was assessed using the evaluation criteria proposed by Moriasi et al. [42] to determine the suitability of the calibrated model for hydrological simulation and subsequent parameter transfer to the ungauged study basin. Due to the limited availability of observed sediment records within the donor basin, formal sediment calibration using SWAT-CUP was not feasible. Therefore, the calibrated hydrological parameter set was transferred back into ARCSWAT for sediment simulation. Observed sediment concentration records available for the years 2004, 2005, 2008, 2009, and 2010 were processed and compared with SWAT-simulated sediment outputs to evaluate model performance. Sediment simulations were conducted for the period 2001–2010 with a warm-up period from 2001–2003. Initial simulations were performed using default sediment parameter values, after which sediment-sensitive parameters were manually adjusted to improve agreement between simulated and observed sediment loads. The final calibrated hydrological and sediment parameter sets were subsequently transferred to the ungauged Bakra River Basin for continuous runoff and sediment simulation. The generated discharge and sediment series were later used as upstream boundary conditions for hydraulic and sediment transport modeling in HEC-RAS.
- (e)
-
SWAT Model Setup and Run in Study Catchment (Bakra Basin): The SWAT model was set up for the ungauged Bakra River Basin using data from the nearby, hydrologically similar Kankai Basin. Watershed delineation, based on a 30-m DEM, divided the 60.5 km2 area into 19 sub-basins, with elevations ranging from 191 m to 2400 m. Land use, soil, and slope maps, as shown in Figure 2b, were combined to define 81 HRUs, enhancing spatial accuracy in simulating runoff and sediment. Daily climate data, as shown in Figure 3c from 1981 to 2024, including rainfall, temperature, and relative humidity, were obtained from NASA’s POWER database to support long-term simulation. The model was run in two phases: first with default parameters (1984–2024) using 1981–1983 as a warm-up, and then with calibrated parameters from the Kankai Basin. Parameter transfer improved reliability in the absence of observed flow data. Outputs included daily streamflow (m3/s) and sediment yield (tons/day) at the outlet. Overall, the model was successfully implemented using available data, with transferred parameters enabling credible simulation of flow and sediment in the Bakra Basin. Generated streamflow (m3/s) was used as quasi-unsteady flow data in the sediment model, whereas a combination of streamflow and sediment yield was used to develop a sediment rating curve, which was used as a sediment boundary condition in the sediment model.
- (f)
-
Flood discharge for various flood events from flood frequency Analysis: Design discharges for return periods of 2, 25, 50, and 100 years were estimated through flood frequency analysis of the annual maximum daily flows simulated by the SWAT model for the Bakra River Basin. Due to the ungauged nature of the basin, the Gumbel distribution method was adopted for estimating extreme flood magnitudes. The obtained results were further verified using empirical approaches commonly applied in ungauged basins, including the modified Dickens, WECS, and Sharma and Adhikari methods [19,43]. Based on comparative evaluation, representative discharge values were selected for hydraulic modeling in HEC-RAS. The finalized steady-flow inputs were Q2 = 78 m3/s, Q25 = 245.7 m3/s, Q50 = 328.2 m3/s, and Q100 = 397.0 m3/s. These discharges were subsequently used for steady-flow flood inundation simulations.
3.2.2. Hydraulic, Sediment, and Hazard Analysis
This subsection presents the hydraulic, sediment transport, and flood hazard analyses conducted using the HEC-RAS modeling environment to evaluate the influence of channel morphological changes on flood behavior in the Bakra River Basin. The methodological framework consists of three interconnected stages, as illustrated in Figure 5. First, (i) hydraulic analysis under the existing river geometry to establish baseline hydraulic conditions, flood inundation extents, and hazard characteristics. (ii) sediment transport simulation followed by hydraulic reanalysis using the updated channel geometry. (iii) Compare results from the original geometry and updated geometry were comparatively evaluated to quantify the effects of sediment-induced morphological changes on flood inundation, hydraulic behavior, and flood hazard levels.
- (i)
-
Hydraulic analysis under the existing river geometry: This subsection describes the hydraulic modeling carried out using HEC-RAS under the existing river geometry to establish baseline flood conditions in the Bakra River Basin. As shown in the workflow diagram in Figure 5, the workflow is further described as follows. (a) Preparation of geometry data. (b) Preparation of steady flow data. (c) Model simulation validation and extraction of results.
- (a)
-
Preparation of geometry data: The hydraulic geometry of the Bakra River Basin was developed in HEC-RAS using terrain information derived from a 30 m × 30 m Digital Elevation Model (DEM) obtained from the Alaska Satellite Facility (ASF) portal. The DEM was clipped to the study area boundary and imported into the RAS Mapper module to generate the terrain layer required for model setup. The modeled river reach extends approximately 1.4 km upstream from the Bakra River bridge, considered as the basin outlet, and about 5 km downstream from that point. Geometric components required for one-dimensional hydraulic simulation, including the river centerline, bank lines, flow paths, and cross-sections, were prepared within HEC-RAS. Cross-section spacing was carefully maintained following the recommendations of the HEC-RAS User’s Manual to ensure hydraulic accuracy and model stability. Excessively close sections may increase computational instability, whereas widely spaced sections may fail to capture important hydraulic variations. The generated geometry was further refined through profile inspection, correction of inconsistencies, and removal of unsuitable cross-sections. Figure 6 shows the river geometry digitized in RAS-MAPPER. Following geometry preparation, Manning’s roughness coefficients were assigned to represent flow resistance within the channel and overbank regions. Initial values were selected from Chow’s roughness reference table (1959) and supported by previous studies conducted in the nearby Kankai River Basin, which exhibits similar geomorphological and land-use characteristics [44,45]. Preliminary Manning’s n values of 0.035 for the main channel and 0.055 for the overbanks were initially adopted. Hydraulic validation involved sensitivity analysis and iterative trial-and-error calibration to improve model performance. The analysis indicated that increasing the overbank roughness produced more realistic hydraulic behavior in vegetated and agricultural floodplain areas. Consequently, the overbank Manning’s n value was finalized at 0.065, while the main channel value remained 0.035. These calibrated roughness values were uniformly applied to all cross-sections using the HEC-RAS Cross Section Editor to ensure consistent hydraulic representation throughout the modeled river reach.
- (b)
-
Preparation of steady flow data: Design discharges selected for hydraulic simulation were 78 m3/s (Q2), 245.7 m3/s (Q25), 328.2 m3/s (Q50), and 397.0 m3/s (Q100) as discussed in Section 3.2.1 (f). These discharge profiles were used as steady-flow inputs in HEC-RAS. Normal depth was assigned as the upstream and downstream boundary condition due to the absence of observed stage data. The boundary condition was defined using average riverbed slopes estimated from the study reach, with values of 0.01118 for the upstream boundary and 0.00612 for the downstream boundary. These slopes were incorporated into Manning’s equation to compute normal depth under steady-flow conditions.
- (c)
-
Model simulation validation and extraction of results: The HEC-RAS model was executed using a one-dimensional steady-flow framework after integrating the prepared geometry, boundary conditions, Manning’s roughness coefficients, and design discharges corresponding to the 2-, 25-, 50-, and 100-year return periods. Hydrodynamic results, including water depth, flow velocity, water surface elevation, flow area, shear stress, and Froude number, were extracted and analyzed to characterize flow behavior throughout the study reach. Model validation was performed by comparing simulated flood extents with inundation boundaries delineated from satellite imagery. Manning’s roughness coefficients were refined through sensitivity analysis and iterative calibration to improve agreement between simulated and observed flood extents. Once satisfactory correspondence was achieved, the validated model was used to generate flood inundation maps for the selected return periods. Flood hazard maps were subsequently developed using simulated depth and velocity outputs. Hazard intensity was quantified using the hazard rating equation,
HR = d(v + 0.5)
where d represents flood depth (m), and v denotes flow velocity (m·s−1). Based on the computed hazard rating values, flood hazard was classified as low (HR < 0.75), medium (0.75 ≤ HR < 1.25), high (1.25 ≤ HR < 2.0), and very high (HR ≥ 2.0). The resulting inundation and hazard maps were used to evaluate the spatial distribution of flood risk across the study area under the case where no riverbed aggradation or degradation is considered (i.e., under the existing river geometry).
- (ii)
-
Sediment transport simulation followed by hydraulic re-analysis using the updated channel geometry: This subsection presents the modeling of long-term sediment transport and the subsequent hydraulic re-analysis using the updated river geometry to examine the effects of morphological changes on flood behavior in the Bakra River Basin. As shown in the flowchart in Figure 5, it is further organized into two sequentially connected stages. (a) HEC-RAS 1-D Sediment Model Setup and Simulation; (b) Re-run steady flow analysis after incorporation of results from sediment simulation.
- (a)
-
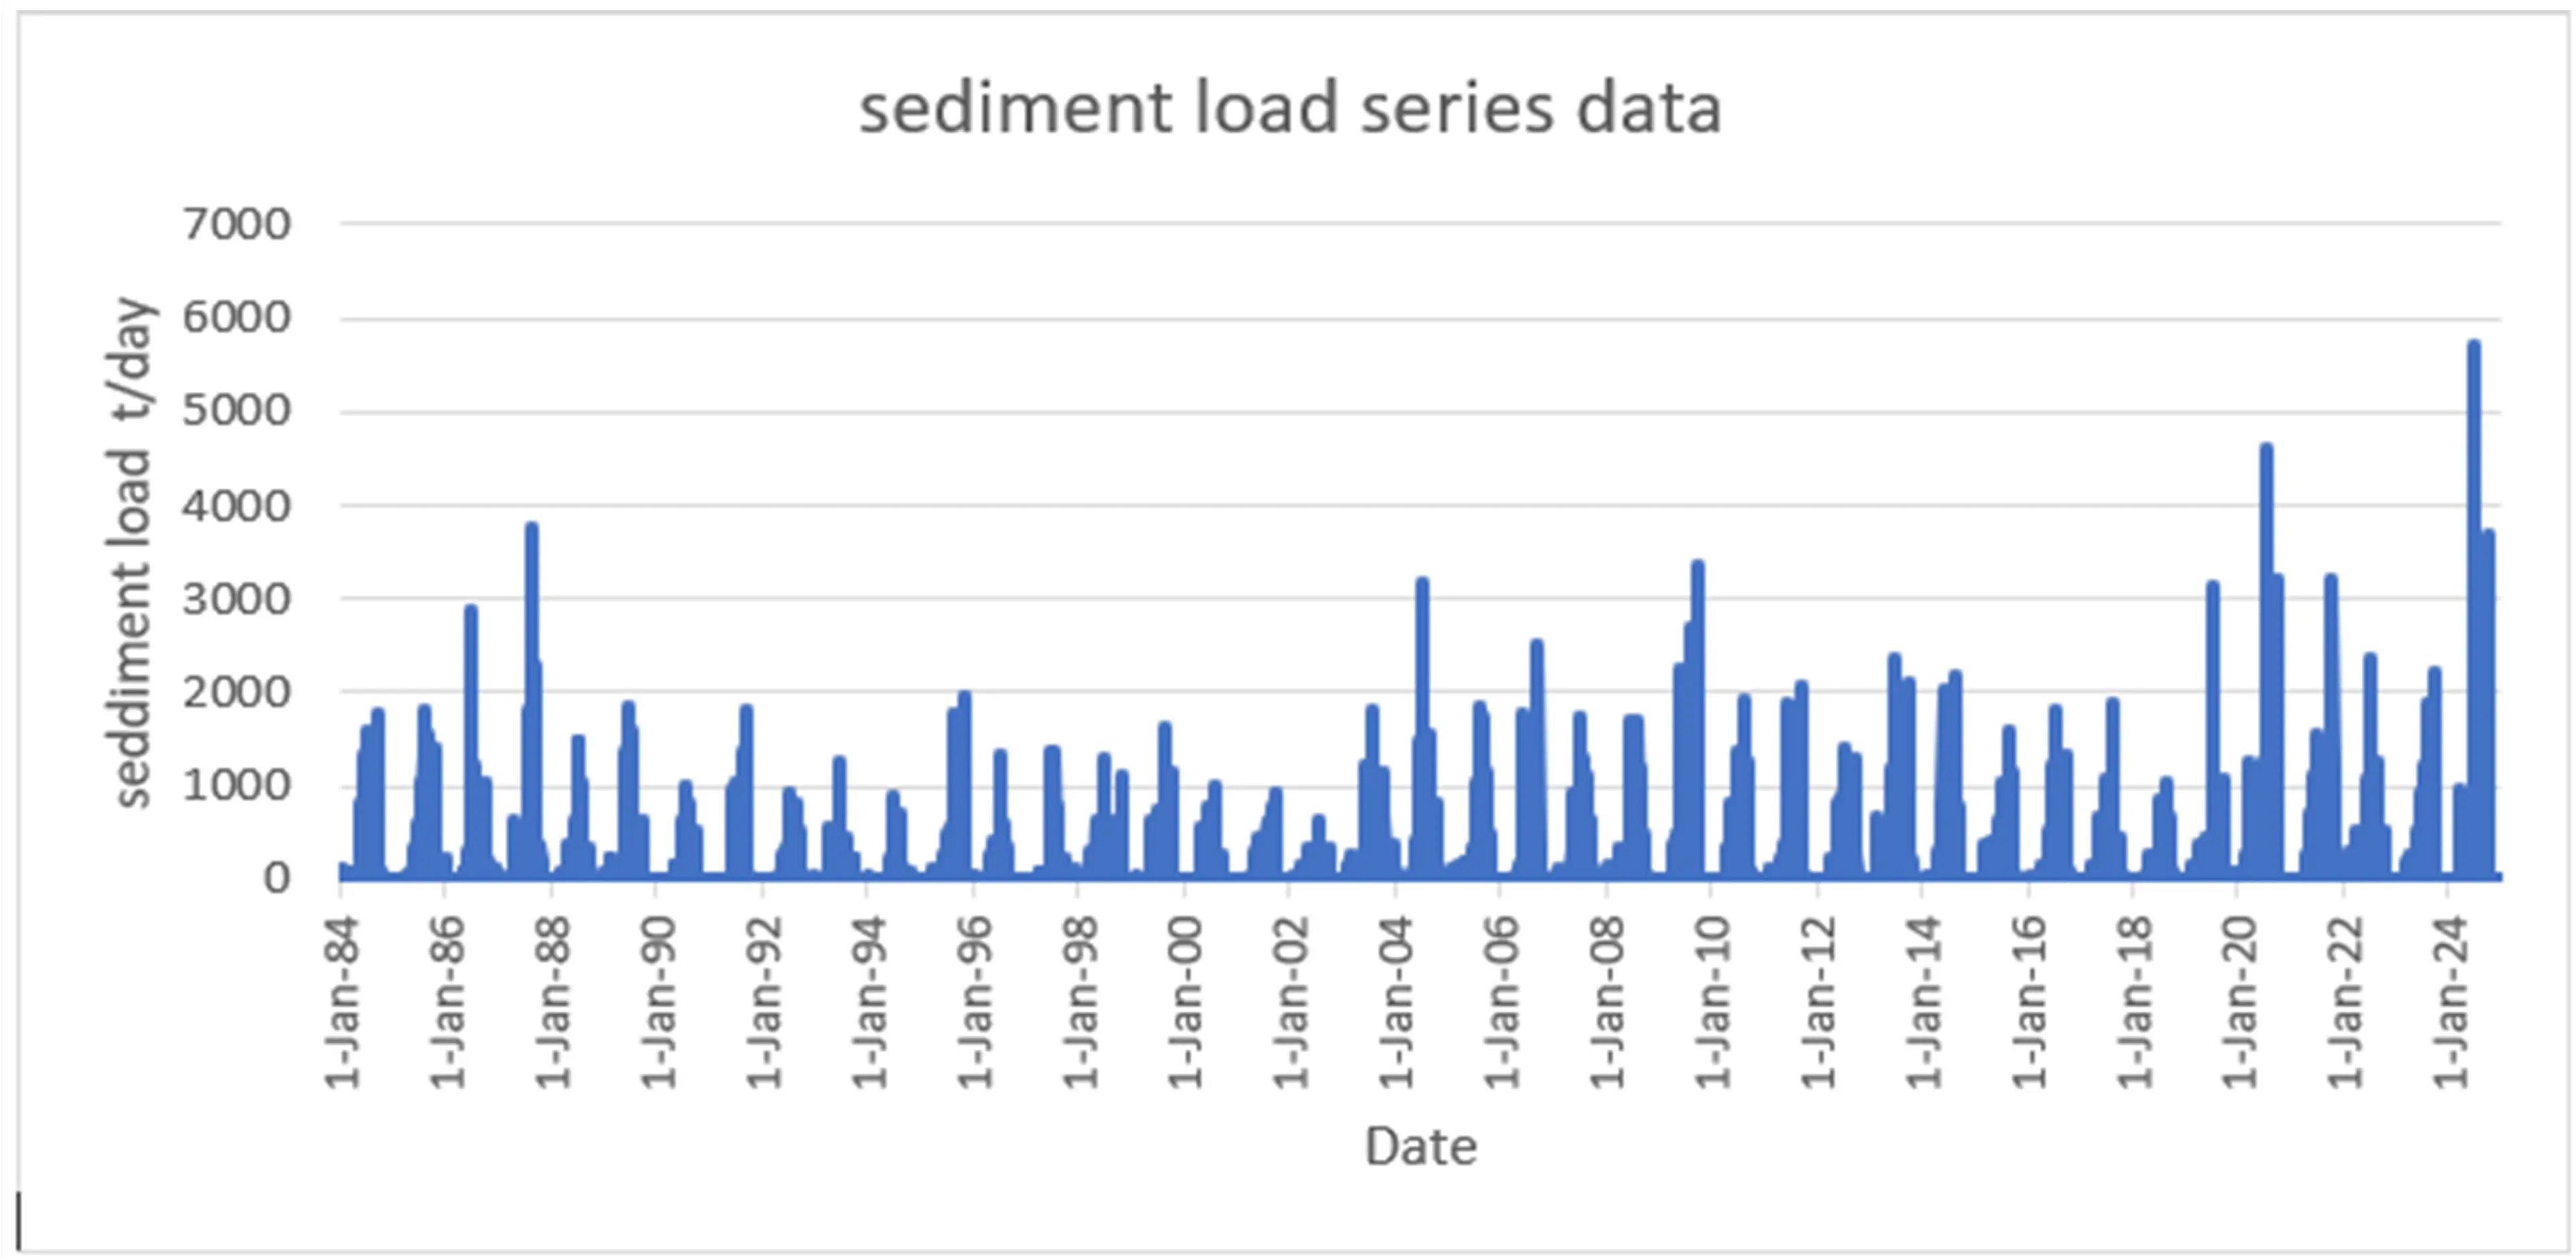
HEC-RAS 1-D Sediment Model Setup and Simulation: The 1D HEC-RAS sediment model was applied to simulate long-term changes in the Bakra River’s bed profile, focusing on aggradation and degradation and their influence on flood behavior. The model used the same calibrated geometry, Manning’s coefficients, and structures from the hydraulic model to maintain consistency. A quasi-unsteady flow approach was adopted using SWAT-simulated discharge data (1984–2024), shown in Figure 7a, averaged over 10-day intervals to reduce computation while preserving seasonal flow variation. A 1-h computation interval and a downstream normal depth boundary with a 0.0062 slope ensured numerical stability, while a constant water temperature of 20 °C represented average river conditions. Sediment characteristics were defined using field samples collected at four locations (Ch 0+000, 1+100, 3+000, and 4+500) and analyzed by sieve tests to generate bed gradation data, with an assumed erodible depth of 4 m. For unsampled reaches, sediment properties were interpolated. Sensitivity analysis of transport equations identified the Meyer-Peter and Müller formula as most suitable for the Bakra’s coarse sediment, combined with Copeland’s (Exner 7) sorting method and all 12 fall velocity options to improve accuracy. A sediment rating curve, Qs = 19.13 × Q0.3631, derived from HEC-RAS sediment calculator outputs using (flow series data and sediment load series data shown in Figure 7a and Figure 7b, respectively), defined boundary conditions, showing how sediment load increases nonlinearly with discharge. The active layer thickness was set using D90 to represent bed armoring, and active layer mixing was enabled for realistic sediment exchange. Model outputs, changes in bed elevation, sediment volume, and spatial patterns of erosion and deposition were used to evaluate long-term morphological behavior and its impact on flood inundation.
- (b)
-
Re-run steady-flow analysis after incorporation of results from sediment model: Following completion of the sediment transport simulation, the final channel geometry obtained from the last sediment-model profile (after 41 years of morphological change) was exported and incorporated into the HEC-RAS hydraulic model as the updated geometry. The previously established steady-flow inputs, boundary conditions, and hydraulic parameters were retained to ensure that any differences in model outputs were solely attributable to sediment-induced morphological changes. The hydraulic model was then re-executed using the updated channel geometry. The resulting hydrodynamic characteristics, flood inundation extents, and hazard distributions were obtained as discussed in Section 3.2.2((i) (c)). These results, therefore, represent the long-term effects of channel aggradation and degradation accumulated over the 41-year simulation period (1984–2024).
- (iii)
-
Compare results from original geometry and updated geometry: Finally, the hydraulic and hazard outputs obtained from the original geometry and updated channel geometry were comparatively evaluated to quantify the impact of channel morphological changes on flood behavior. Variations in inundation extent, flood depth, velocity distribution, and hazard intensity were analyzed to understand the role of sediment-induced channel modifications in altering flood risk within the study area.
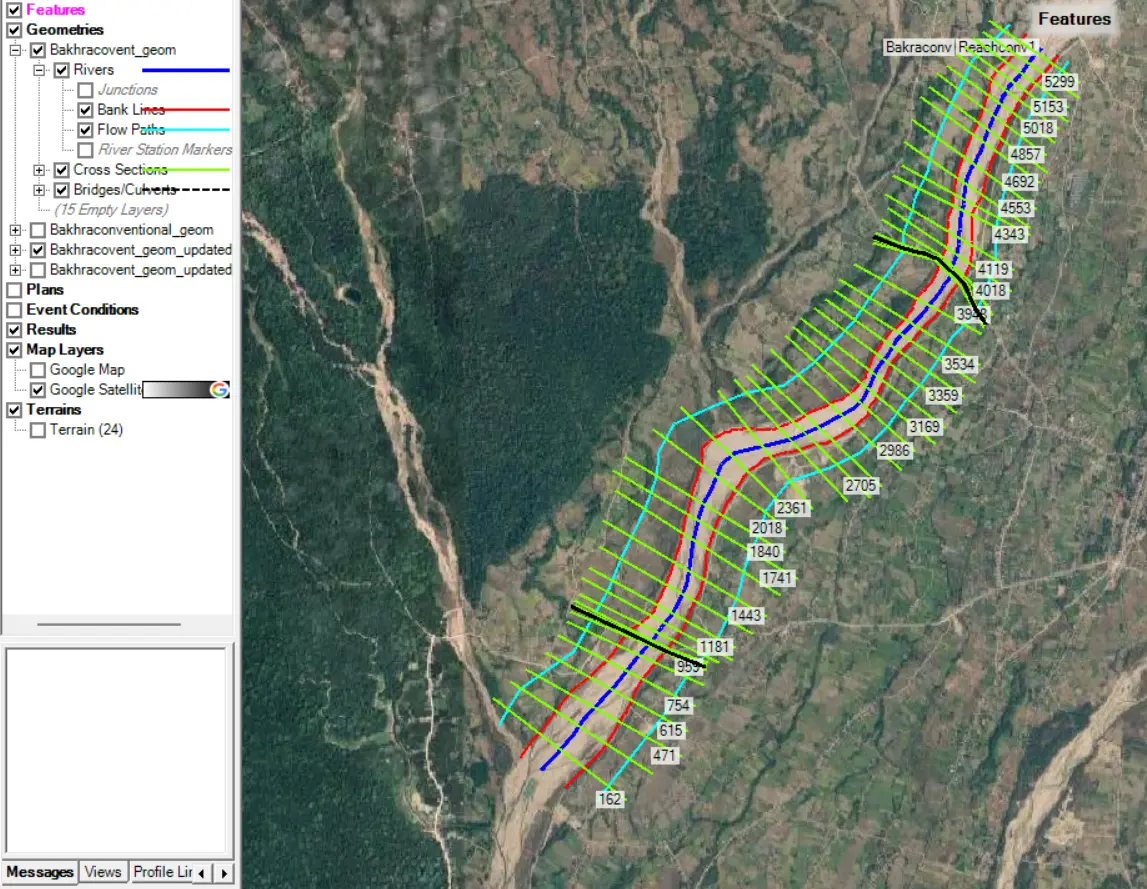
Figure 6. RAS-MAPPER showing river cross-section bank line, center line and flow line in initial geometry.
|
(a) |
 |
|
(b) |
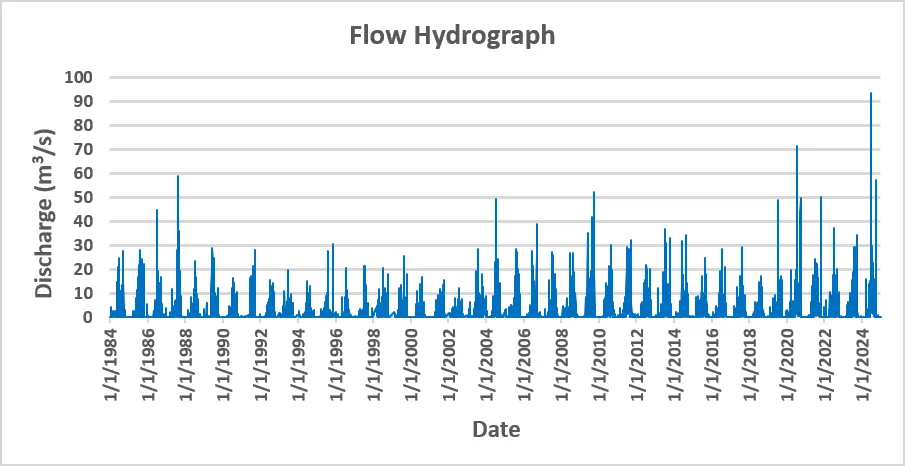
Figure 7. (a) Long-term flow series data output from SWAT 1984–2024. (b) sediment load series data output from SWAT 1984–2024.
4. Results and Discussion
4.1. Hydrological Modeling Results
4.1.1. Best-Fitted Parameters
Model calibration was performed using the available observed discharge data for the calibration period. The process involved adjusting the most sensitive hydrological parameters influencing surface runoff, groundwater flow, soil water dynamics, and channel response. The calibrated parameters included CN2, ALPHA_BF, GW_DELAY, GWQMN, GW_REVAP, SOL_AWC, ESCO, HRU_SLP, OV_N, SLSUBBSN, SOL_K, and SOL_BD. Parameter optimization was carried out within physically realistic ranges to improve the agreement between simulated and observed streamflow. The final calibrated parameter set was subsequently applied during model validation without further modification. The best-fitted values together with their corresponding minimum and maximum after four iterative calibration cycles consisting of 500 simulations, are presented in Table 2.
Table 2. Best Parameter Fitted Value.
|
Parameter Name |
Fitted Value |
Min Value |
Max Value |
|---|---|---|---|
|
1:R_CN2.mgt |
0.350923 |
−0.0199 |
0.3999 |
|
2:V_ALPHA_BF.gw |
1.194164 |
0.419051 |
1.330949 |
|
3:V_GW_DELAY.gw |
187.281387 |
81.1347 |
335.81146 |
|
4:V_GWQMN.gw |
720.972656 |
633.975342 |
941.024658 |
|
5:R_GW_REVAP.gw |
−0.007625 |
−0.025619 |
0.128619 |
|
6:R_SOL_AWC(..).sol |
0.482109 |
0.196202 |
0.630962 |
|
7:V_ESCO.hru |
1.030692 |
0.879315 |
1.050685 |
|
8:R_HRU_SLP.hru |
0.048411 |
0.009393 |
0.150907 |
|
9:R_OV_N.hru |
0.390564 |
0.213092 |
0.684632 |
|
10:R_SLSUBBSN.hru |
142.834702 |
57.021133 |
157.978149 |
|
11:R_SOL_K(..).sol |
−1.431999 |
−1.565679 |
0.045679 |
|
12:R_SOL_BD(..).sol |
0.466595 |
−0.176537 |
0.551537 |
4.1.2. Sensitive Parameters
The Model most sensitive parameters are shown as dotty plots in Figure 8.
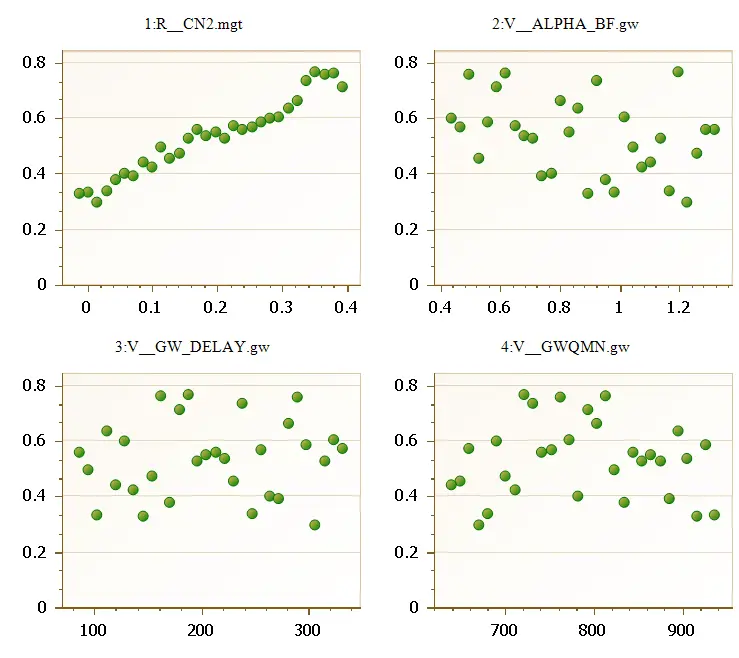
Analysis of the dotty plots, as shown in Figure 8, indicated that model performance was more responsive to variations in CN2 than to changes in the other parameters. In contrast, ALPHA_BF, GW_DELAY, and GWQMN exhibited greater dispersion, reflecting lower parameter sensitivity and increased equifinality during calibration. Thus, CN2 was identified as the most sensitive parameter, reflecting its strong control on surface runoff and simulated streamflow.
4.1.3. Calibration and Validation
Calibration and Validation Output for Discharge
Figure 9a presents a comparison between simulated and observed discharges for the calibration (2010–2014) period. Figure 9b presents a comparison between simulated and observed discharge for the validation (2015–2019) period. The solid line shows the simulated output, and the dotted line shows the observed discharge. During calibration, a warm-up period from 2007–2009 was used to stabilize the model’s initial conditions, after which the simulated hydrograph showed strong agreement with the observed discharge series. Similarly, for the validation period, a warm-up period of 2012–2014 was considered prior to performance evaluation, and the simulated discharge closely followed the observed trends.
The hydrological model demonstrated good predictive performance during both the calibration and validation periods, achieving NSE values between 0.77 and 0.78 and R2 values between 0.79 and 0.83. These results were obtained through the donor-basin regionalization framework illustrated in Figure 4, in which the SWAT model was calibrated and validated in the gauged Kankai River Basin before transferring the optimized parameter set to the ungauged Bakra River Basin. The satisfactory model performance indicates that the transferred parameters adequately represented the dominant hydrological processes and provided reliable discharge estimates for subsequent sediment transport and hydraulic simulations.
The obtained performance is comparable to that reported by Mosavi et al. [46], who applied a clustering-based regionalization approach to transfer SWAT parameters among hydrologically similar watersheds and achieved NSE and R2 values exceeding 0.70. While their framework relied on grouping multiple watersheds using Fuzzy C-Means clustering, the present study employed a direct donor-basin transfer approach. Despite these methodological differences, both studies demonstrate that regionalized parameter transfer can provide reliable streamflow predictions in ungauged basins. Unlike Mosavi et al. [46], where the objective was streamflow estimation, the discharge series generated in this study served as the foundation for sediment modelling, riverbed evolution analysis, and flood hazard assessment, thereby supporting the broader SWAT–HEC-RAS framework adopted to evaluate the influence of morphological change on flood behavior in the Bakra River Basin.
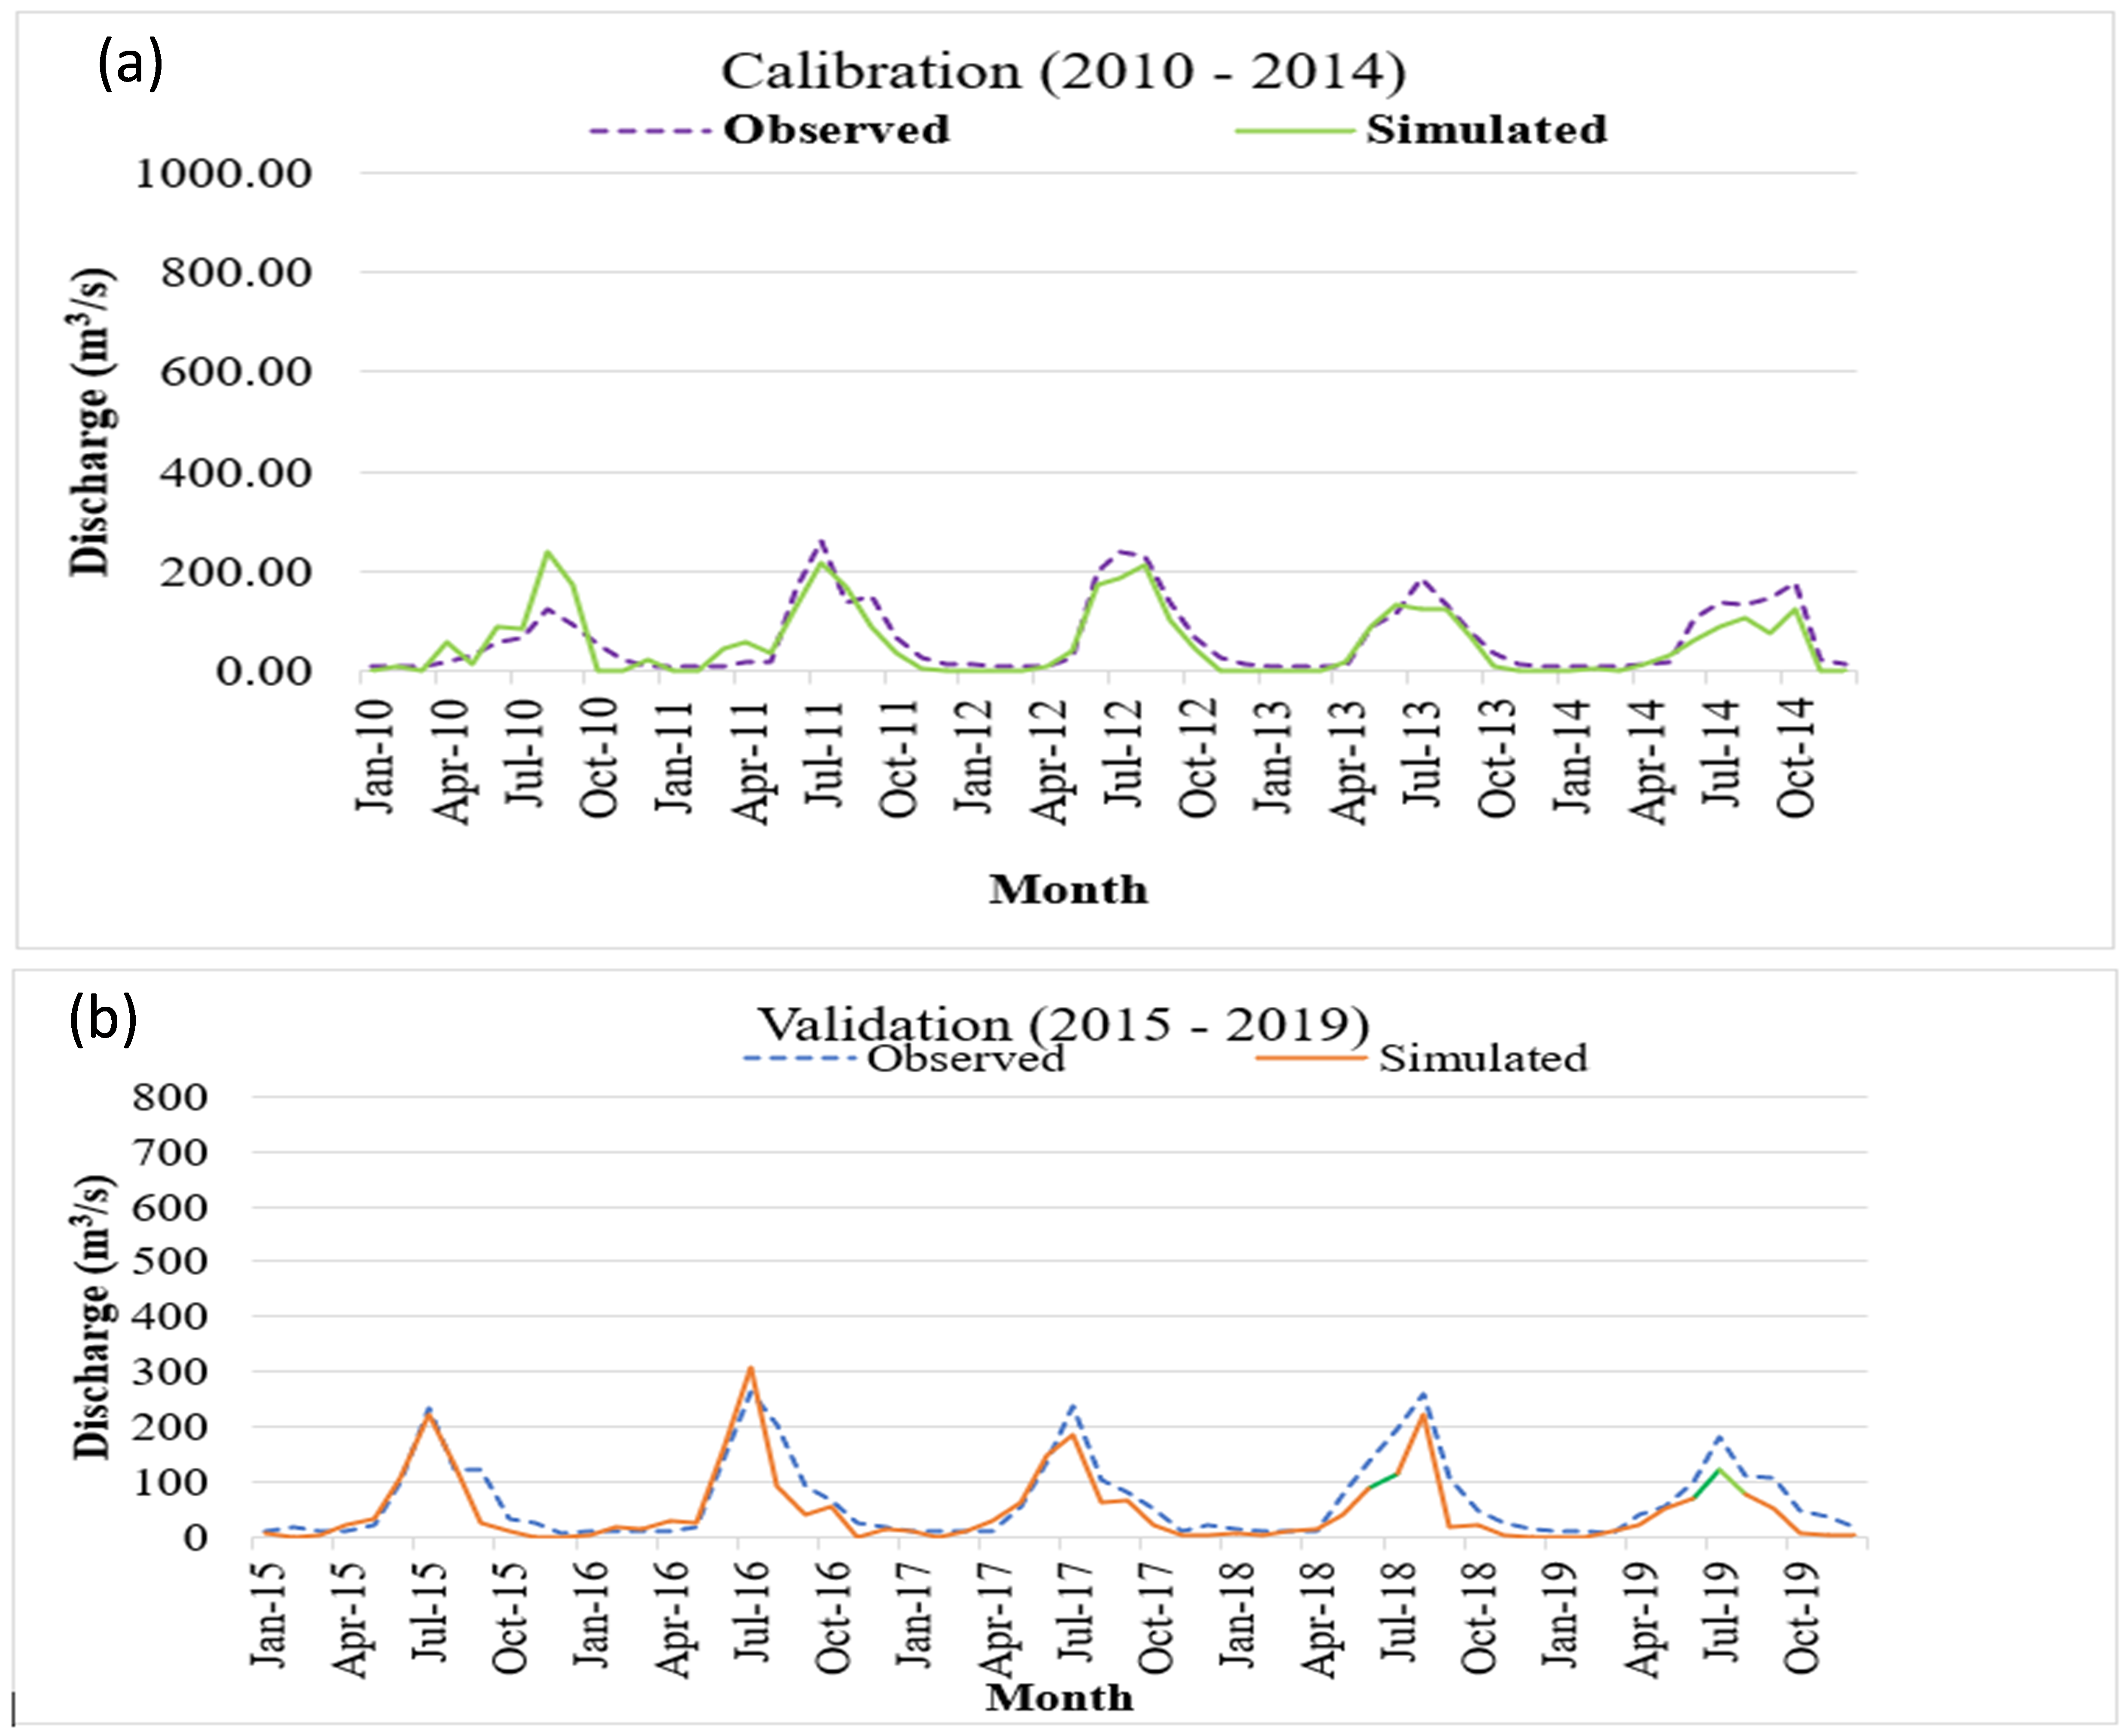
Figure 9. (a) Best Simulation Calibrated Discharge Output for 2010–2014. (b) Best Simulation Validation Discharge Output for 2015–2019.
Figure 10 illustrates the relationship between the best-simulated and observed discharges for the calibration and validation periods through fitted trendlines. Results indicate a strong correlation between simulated and observed streamflow, with a coefficient of determination (R2) of 0.79 during the calibration period and R2 of 0.83 during the validation period. Higher R2 value obtained during validation suggests that the model reproduced the observed discharge more accurately in the validation phase than in the calibration phase. These results demonstrate the model’s satisfactory predictive capability and its effectiveness in simulating streamflow dynamics within the study watershed. Furthermore, the objective function results indicate that during the calibration period, the model achieved NSE = 0.77, PBIAS = 14.2, and RSR = 0.48, while during the validation period, the corresponding values were NSE = 0.78, PBIAS = 27.3, and RSR = 0.48. According to the performance rating criteria of Moriasi et al. [42], these statistics fall within the satisfactory to very good range, indicating that the simulated hydrograph closely matches the observed discharge. Overall, the model demonstrates reliable performance in reproducing streamflow dynamics during both the calibration and validation phases.
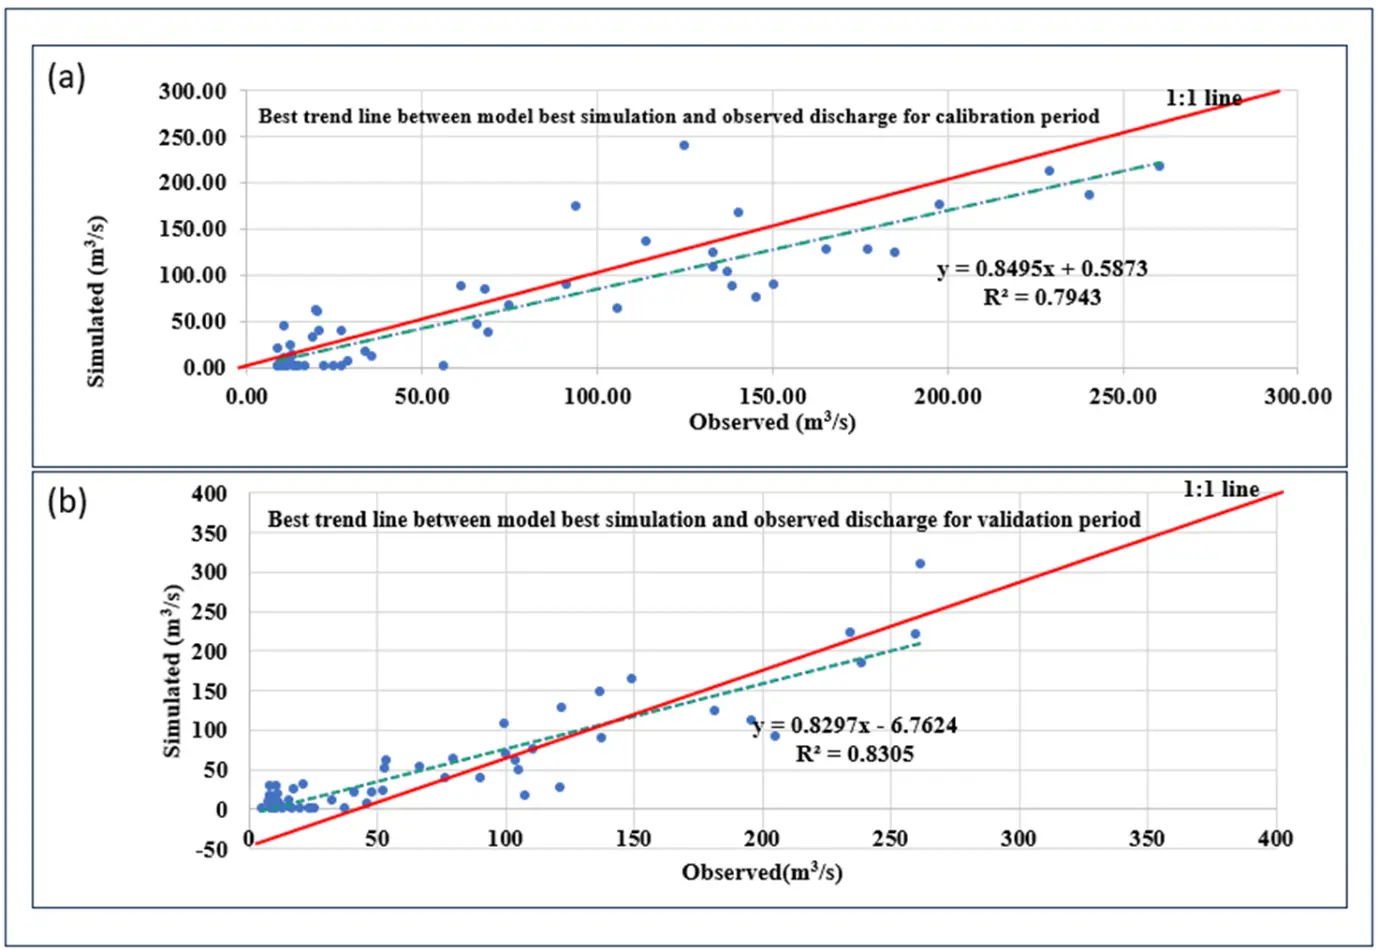
Figure 10. Best trend line between model best simulation and observed discharge for (a) calibration period and (b) validation period.
Calibration and Validation Output for Sediment
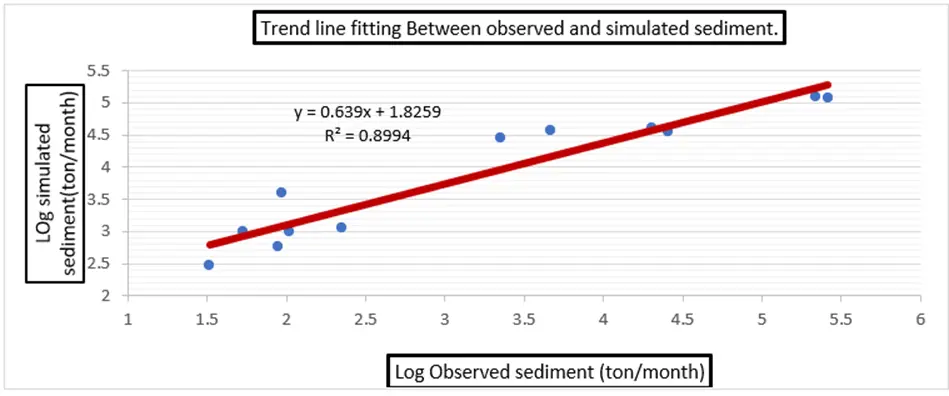
The relationship between simulated and observed sediment yield (t/month) is illustrated in Figure 11 using fitted trendlines. Sediment model performance was evaluated for the period 2001–2010 following a three-year warm-up period (2001–2003), as outlined in Section 3.2.1(d). A strong correlation was obtained between simulated and observed sediment yields, with an R2 value of 0.89, indicating that the model satisfactorily captures the observed sediment dynamics and can reliably simulate sediment transport processes in the watershed.
These results were obtained through the modelling framework illustrated in Figure 4, in which SWAT was calibrated and validated in the gauged Kankai River Basin before transferring the optimized parameter set to the ungauged Bakra River Basin. The calibrated model generated continuous sediment yield series that were subsequently used as boundary conditions for the HEC-RAS sediment model. Therefore, the accuracy of sediment simulation was essential for representing long-term erosion and deposition processes and their influence on channel evolution.
The obtained performance is comparable to that reported by K.C. et al. [21], who applied SWAT to the ungauged Fusre River Basin in Nepal and achieved R2 values of 0.95 during calibration and 0.85 during validation. Their study combined SWAT-based sediment modelling with rainfall simulator experiments to evaluate sediment generation under different watershed conditions, whereas the present study employed a donor-basin regionalization approach to generate sediment inputs for subsequent morphological and flood-hazard analyses. Despite these methodological differences, both studies demonstrate the capability of SWAT to reliably reproduce sediment dynamics in data-scarce Himalayan catchments. Unlike K.C. et al. [21], where the primary objective was sediment yield assessment, the simulated sediment series generated in this study served as a critical input for HEC-RAS sediment modelling, enabling evaluation of long-term riverbed evolution and its subsequent impact on flood inundation and hazard characteristics in the Bakra River Basin.
4.2. Hydraulic Model Results
The simulated flood results from the HEC-RAS model were validated using satellite imagery. The extent of the flooded area observed in the satellite image was the primary reference for comparison. It was assumed that the visible flood marks represented frequently occurring flood events, roughly equivalent to a 2-year return period flood. Figure 12 and Table 3 present validation of the HEC-RAS hydraulic results.
The hydraulic model achieved a validation accuracy of 94%, indicating good agreement between the simulated inundation extent and the flood extent interpreted from satellite imagery. This result is comparable to previous HEC-RAS-based flood inundation studies conducted in Nepal, which reported validation accuracies of 95.97% in the Kamla River Basin, 95.7% in the Babai River Basin, and 85.6% in the Ratuwa River Basin, demonstrating the reliability of the present hydraulic modeling approach [9,10,13].
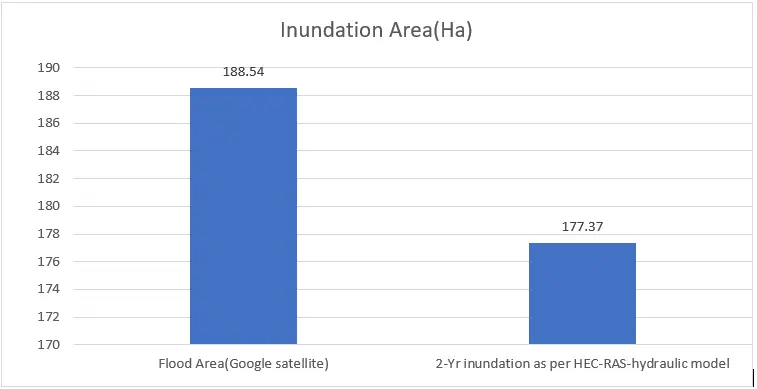
Figure 12. Inundation area plot for validation of hydraulic model between flood area obtained from Google satellite images and from HEC-RAS hydraulic model.
Table 3. Validation of Inundation Area.
|
River |
2-Yr-Inundation-Model |
Satellite |
Model (val%) |
|---|---|---|---|
|
Bakra |
177.36 |
188.54 |
94.0 |
4.3. HEC-RAS Sediment Model Results
The results from HEC-RAS sediment results are shown in Figure 13. This presents the spatial and longitudinal distribution of riverbed morphological changes simulated by HEC-RAS over a 41-year period ending on 26 December 2024. In Figure 13a, aggradation zones are represented in yellow, indicating areas of sediment deposition and bed elevation increase, whereas degradation zones are shown in red, representing bed erosion and channel lowering. The spatial distribution reveals that degradation is the dominant morphological process throughout most of the Bakra River reach, while aggradation is confined to several localized sections.
The longitudinal invert change in profile in Figure 13b further illustrates the magnitude and location of bed-level adjustments, with positive values indicating aggradation and negative values indicating degradation. The maximum aggradation of approximately +2.1 m occurred near 1200 m from downstream, where reduced flow velocity and channel gradient favored sediment deposition. Conversely, the greatest degradation, reaching about −4.0 m, was observed near 500 m and 4000 m downstream, reflecting intensified erosional activity under higher flow energy conditions. Overall, the predominance of degradation suggests a long-term trend of channel incision within the study reach.
The morphological changes shown in Figure 13 were generated through the integrated modelling framework illustrated in Figure 4 and Figure 5. Owing to the absence of observed discharge and sediment records in the Bakra River, a donor-basin regionalization approach was adopted in which a SWAT model calibrated and validated in the Kankai River Basin was transferred to the study basin. The resulting discharge and sediment series were used as boundary conditions for the HEC-RAS sediment model, together with channel geometry and sediment characteristics. Through application of the sediment continuity equation over the 41-year simulation period, the model simulated erosion and deposition processes and produced the updated channel geometry shown in Figure 13. The predominance of degradation, therefore, reflects the cumulative response of the river to long-term hydrological and sediment transport conditions.
A similar study has been done in River Caldew by Pender et al. [20], highlighting differences in both methodology and channel response. Pender et al. [20] investigated the gauged River Caldew using observed flow records and multiple synthetic flow sequences that combine a hidden Markov model (HMM) with the generalized Pareto distribution (GP) to simulate 50 years of channel evolution, identifying worst-case aggradation and degradation scenarios. In contrast, the present study employed a coupled SWAT–HEC-RAS framework to generate a continuous 41-year morphological trajectory for an ungauged river. Despite these methodological differences, both studies demonstrate the sensitivity of river morphology to long-term flow and sediment transport processes. However, whereas Pender et al. reported predominantly aggradational conditions, the Bakra River exhibited widespread degradation with only localized aggradation zones, suggesting that channel evolution is strongly controlled by basin-specific hydrological and sediment regimes.

Figure 13. Invert changes along the river reach after 41 years of morphological change (a) map view and (b) longitudinal profile of invert changes.
4.4. Hydrodynamic Results
Hydrodynamic results presented in the form of comparison of velocity profile Figure 14a and water surface profile Figure 14b along the study reach for the following two cases (i) when the impact of riverbed aggradation and degradation is ignored (considering original riverbed geometry). (ii) when the impact of riverbed aggradation and degradation is considered.
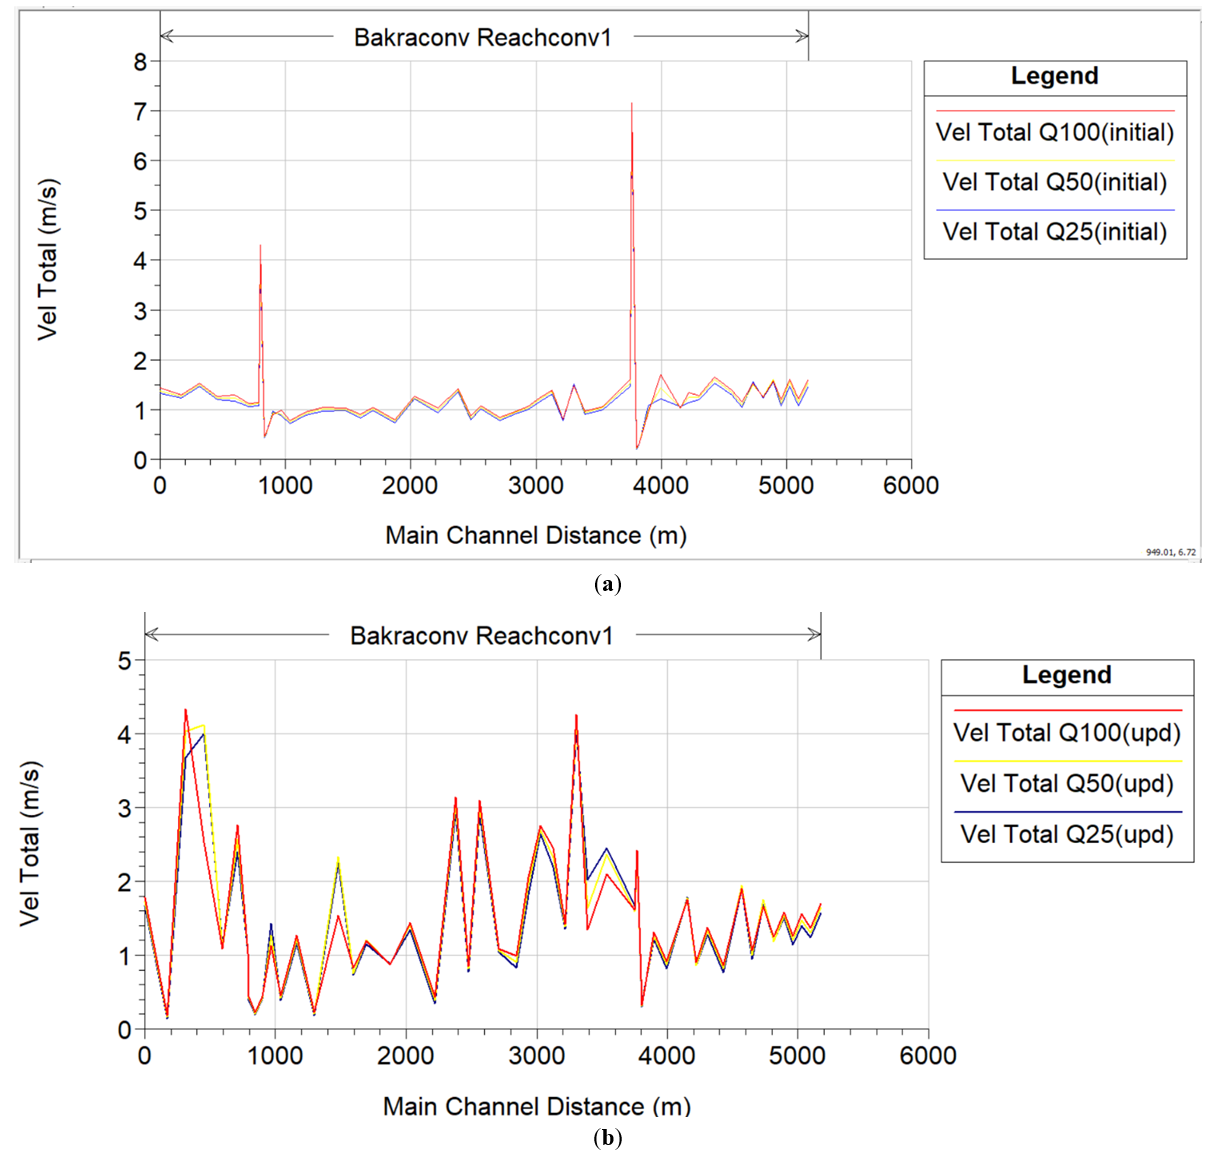
Figure 14. Plot of velocity along the main channel for various return periods (a) without considering riverbed aggradation and degradation. (b) with considering riverbed aggradation and degradation.
From Figure 14a,b, considering riverbed aggradation and degradation notably changed the velocity pattern of the Bakra River. When bed changes were included, overall flow velocity decreased in the upper reaches due to sediment buildup that raised the bed and reduced flow depth, whereas degraded downstream sections showed slightly higher velocities due to increased channel confinement. The maximum velocity dropped from about 3.8 m/s in unaltered conditions to around 2.9 m/s after aggradation, whereas some degraded reaches exceeded 4.0 m/s. These variations reveal how sediment-driven bed changes alter hydraulic behavior, shifting high-velocity zones and affecting flood conveyance near critical structures such as bridges. Overall, the results highlight that including riverbed dynamics gives a more realistic picture of flow and flood behavior in sediment-prone, ungauged rivers.
The comparison of water surface profiles along the Bakra River, with and without considering riverbed aggradation and degradation, shown in Figure 15, reveals subtle but important differences in hydraulic behavior. The updated profile, which accounts for long-term bed changes, generally shows slightly lower water surface elevations than the original profile, indicating increased channel capacity due to downstream degradation. However, localized aggradation in some reaches, particularly near the upstream bridge at 960 m and the downstream bridge at 3960 m, caused minor water level rises that could increase flood risk around these structures. Overall, while the longitudinal trend of both profiles remains similar, the observed deviations highlight that sediment-induced morphological changes significantly influence flow depth and potential inundation near critical infrastructure.
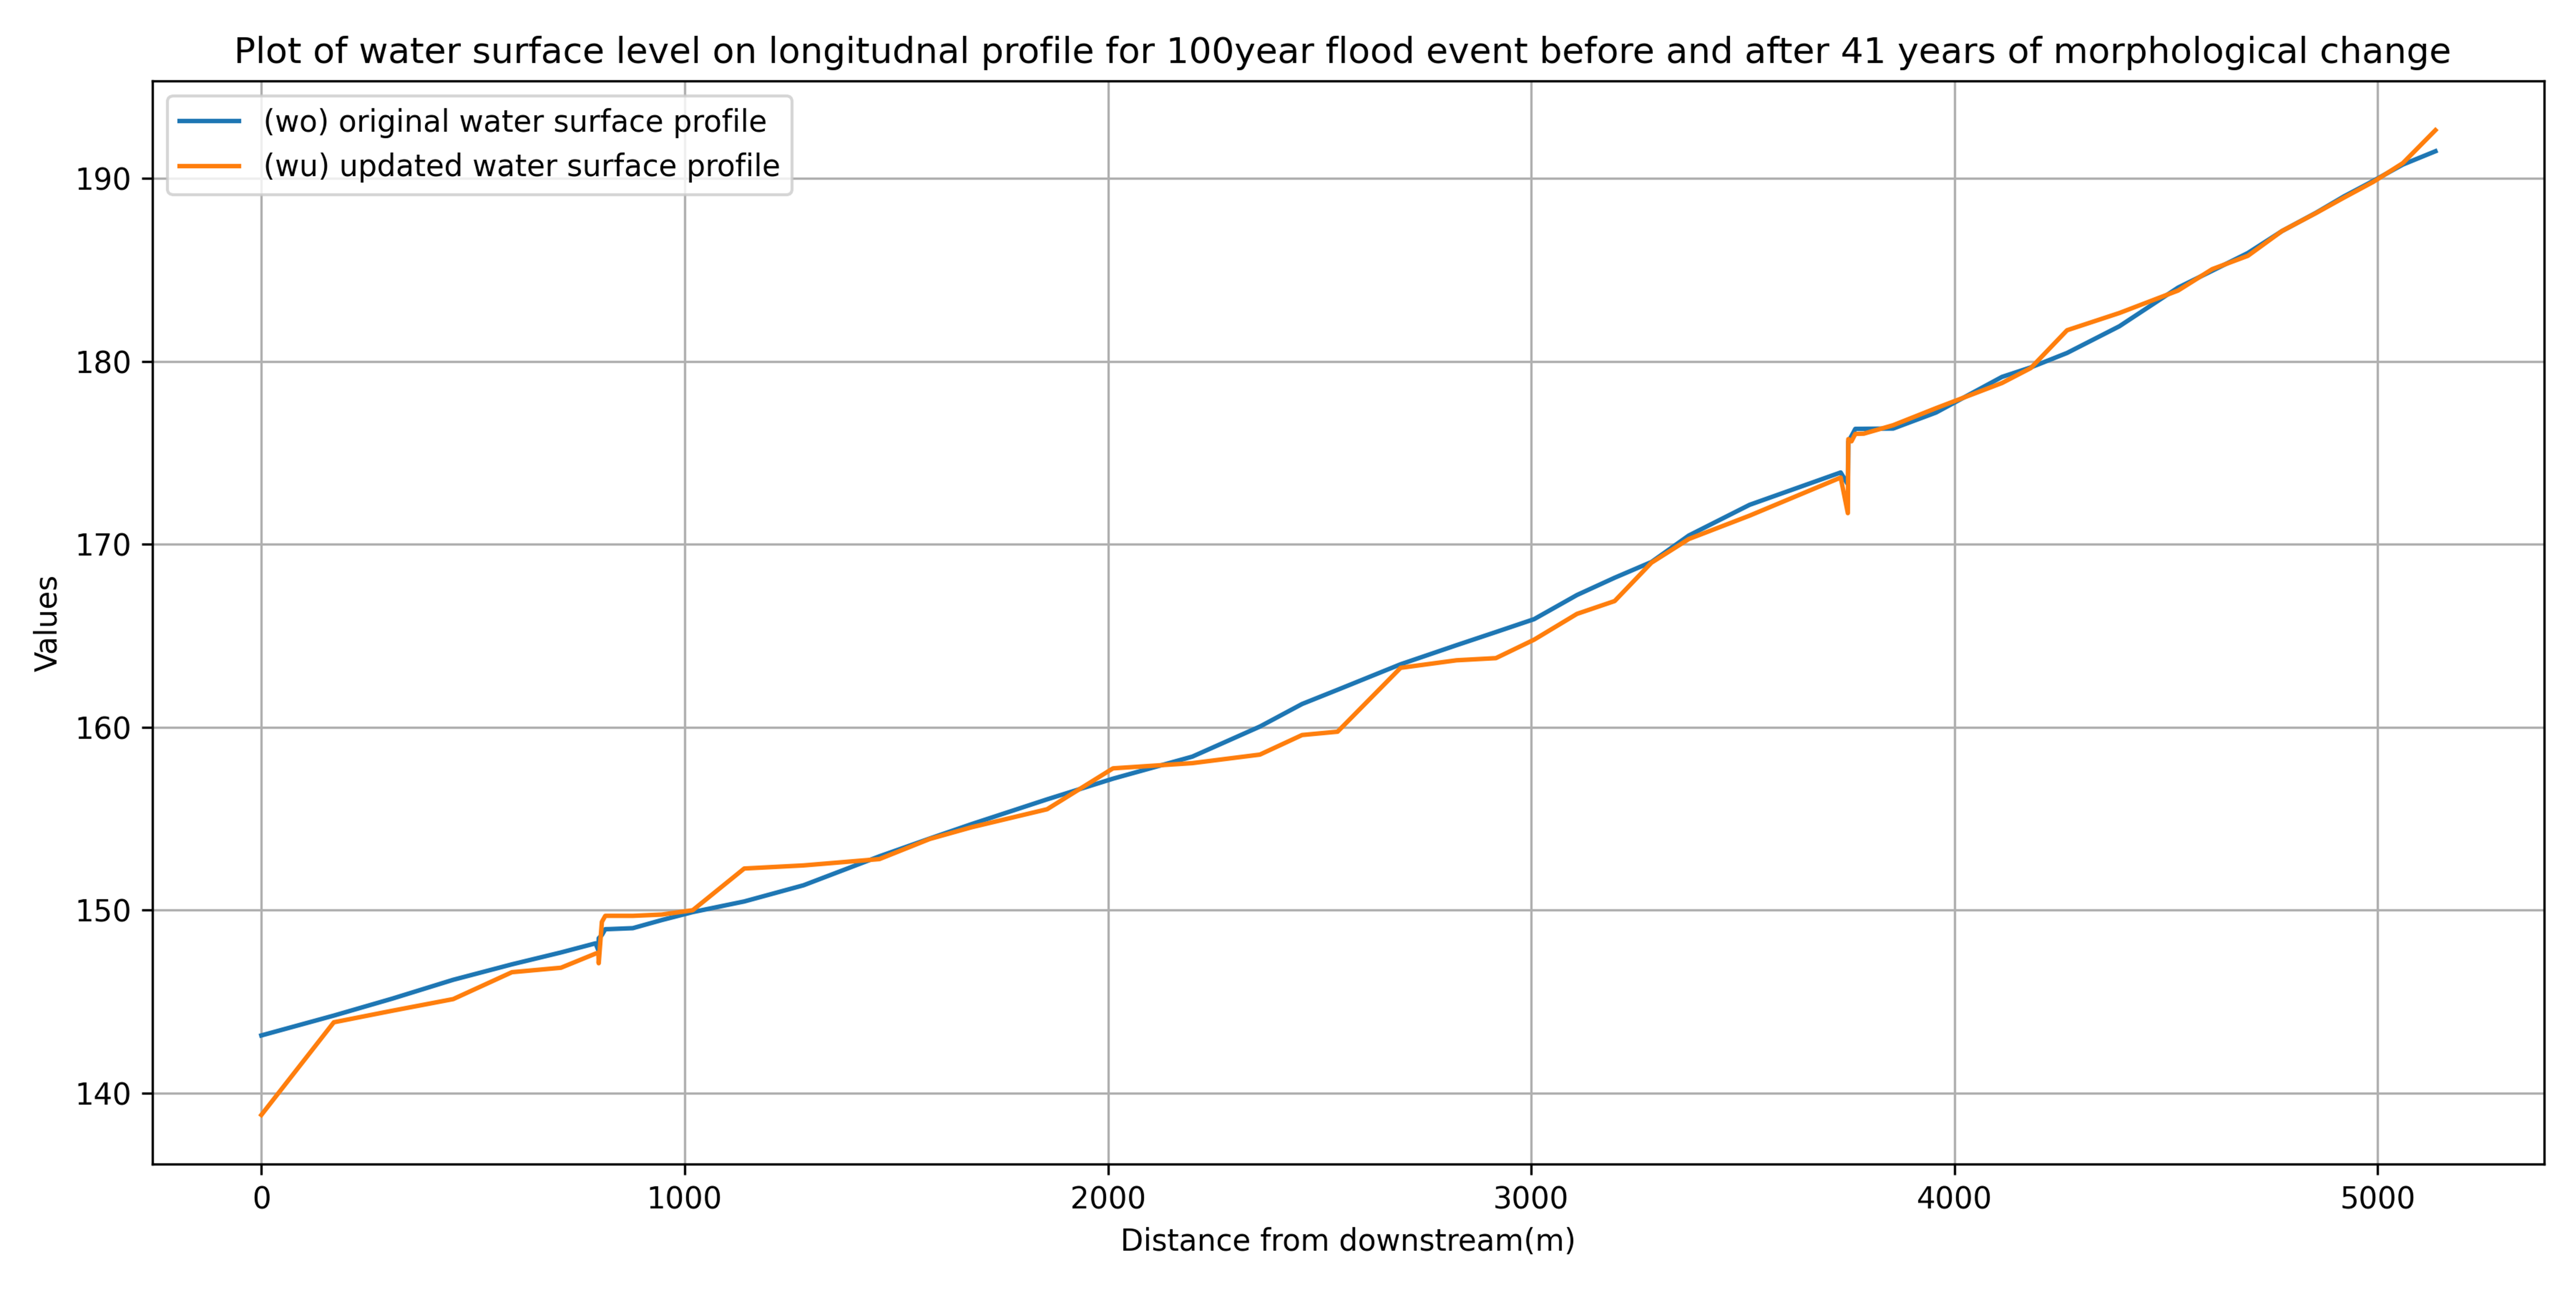
Figure 15. Comparison of water surface profile without riverbed aggradation and degradation (original water surface profile) vs. water surface profile with riverbed aggradation and degradation (updated water surface profile).
4.5. Inundation Results
From bar graph Figure 16, it is seen that the inundation area decreases for the case when riverbed aggradation and degradation are considered for a particular flood event. Although inundation area increases for all cases without and with riverbed aggradation and degradation for an increase in return period.
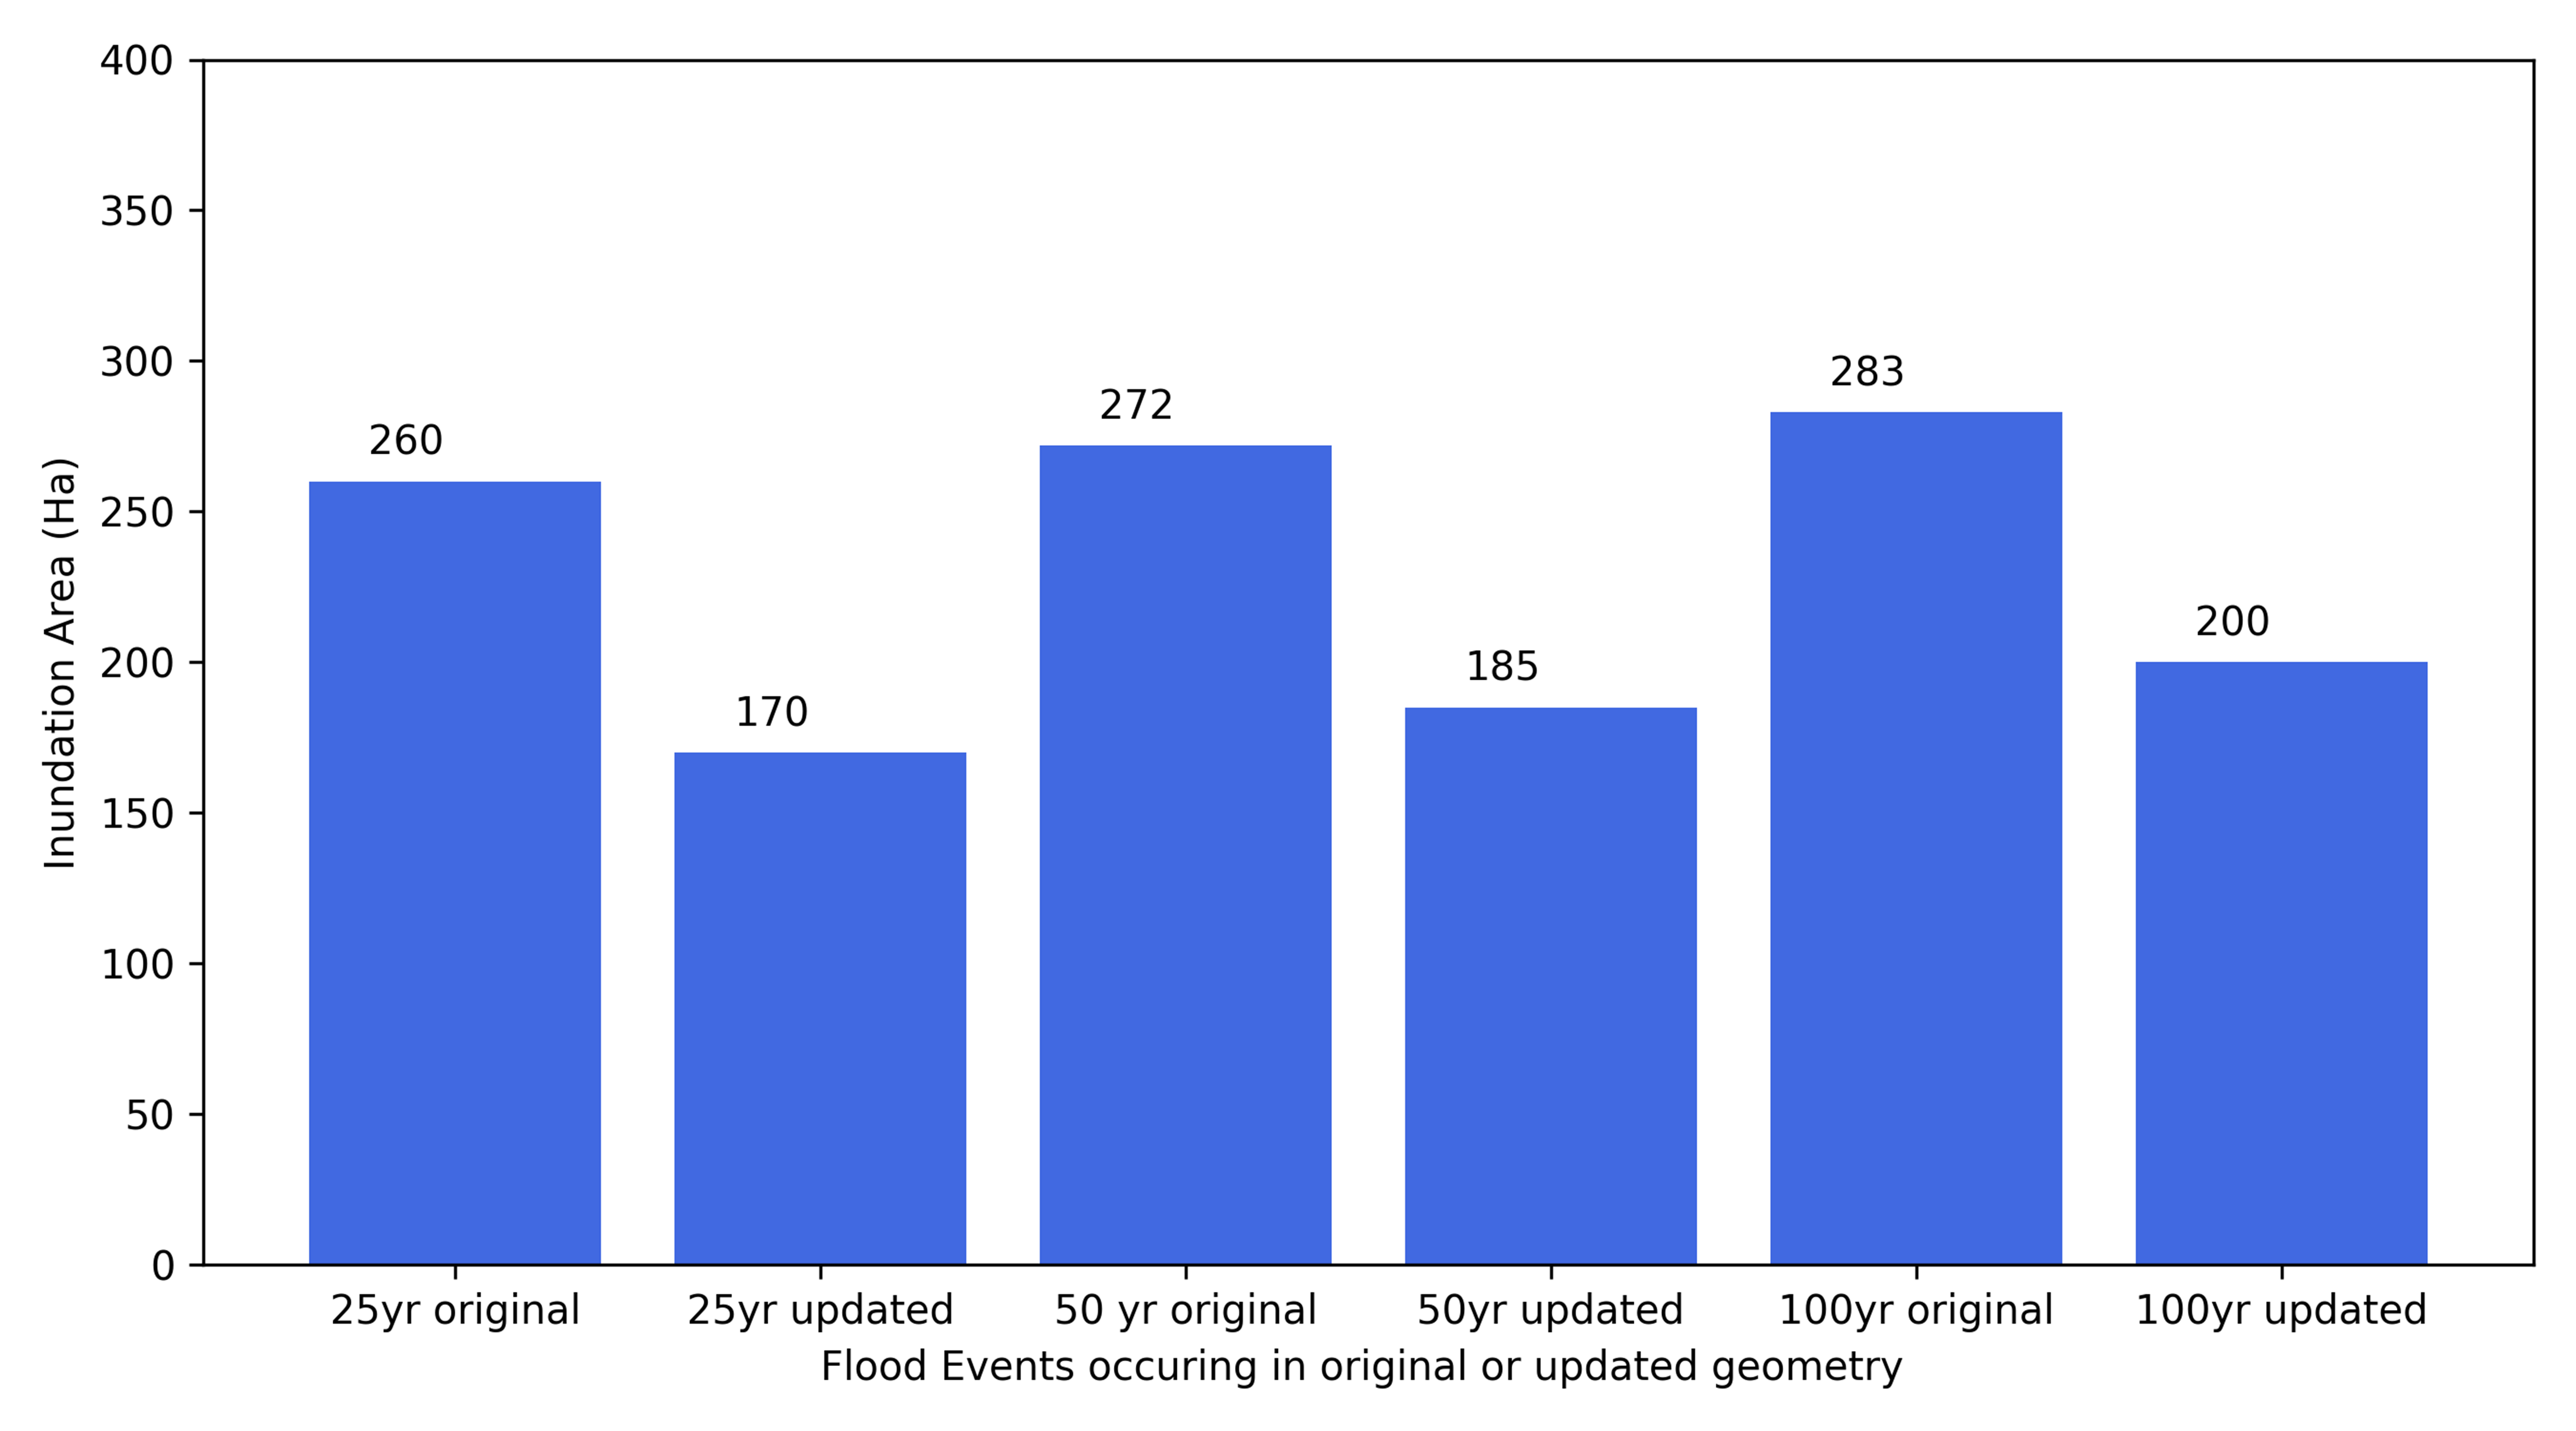
Figure 16. Flood Inundation area for 25 yr, 50 yr, and 100 yr return periods for initial river geometry and updated geometry (without and with considering riverbed aggradation and degradation).
4.6. Flood Hazard Mapping and Analysis
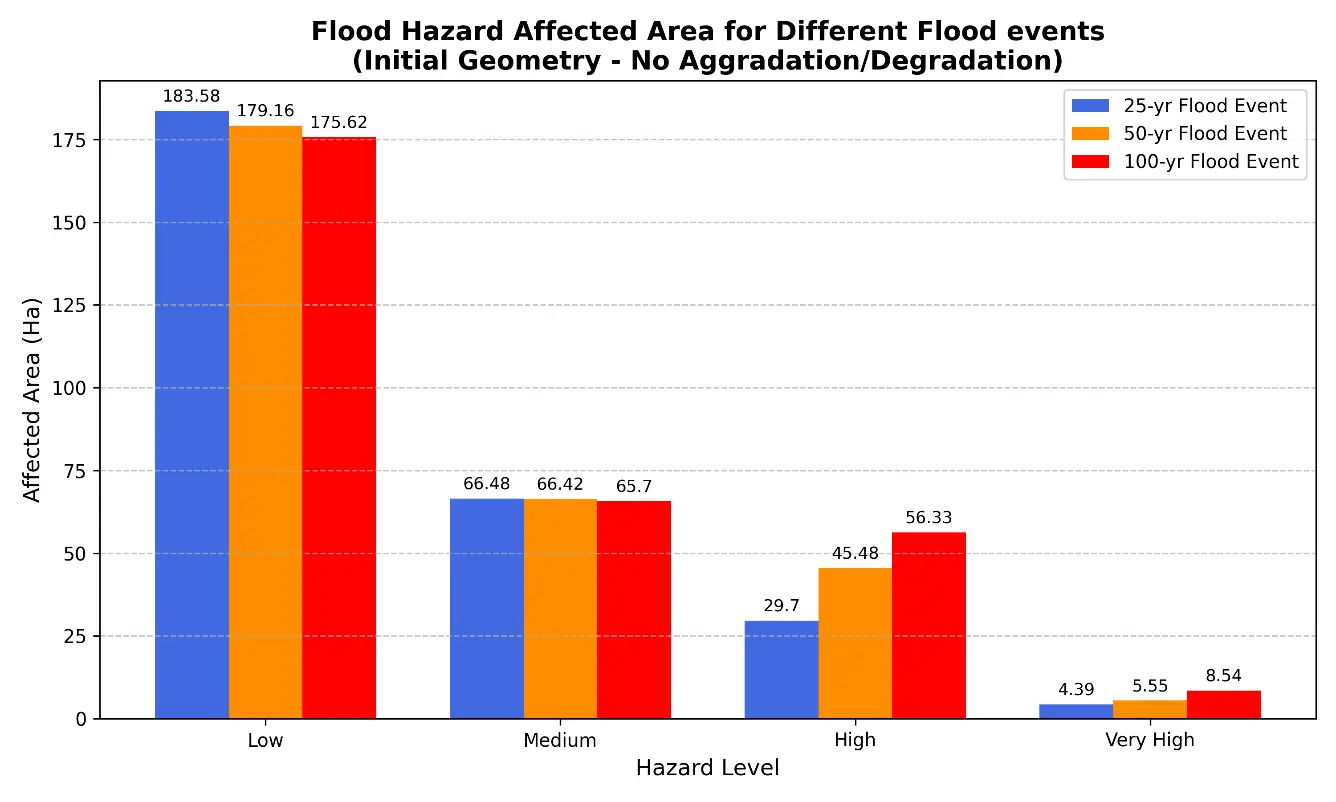
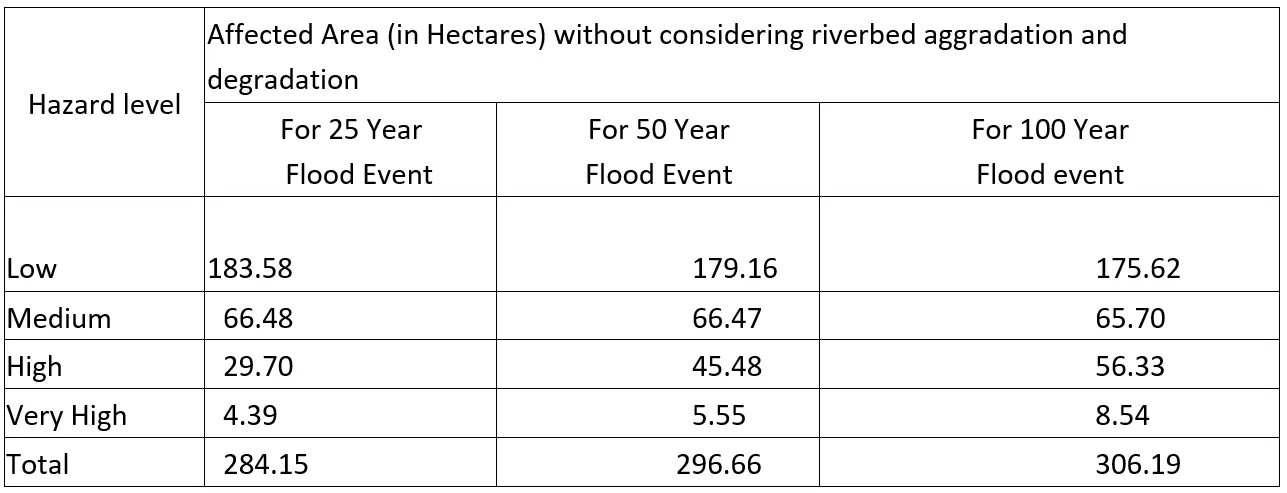
Figure 17a illustrates a graphical plot, and Figure 17b shows a tabular representation of the area affected under various hazard levels and various flood events, considering the case when the impact of riverbed aggradation and degradation is not considered. It is seen that the low hazard class constitutes the largest proportion of the hazard-affected area for all return periods, indicating the predominance of relatively low-intensity flooding across the floodplain. However, with increasing flood magnitude, the high hazard area expands from 29.70 ha to 56.33 ha, while the very high hazard area nearly doubles from 4.39 ha to 8.54 ha. In contrast, the low hazard area decreases from 183.58 ha to 175.62 ha, suggesting a gradual transition of inundated areas into more severe hazard categories. The total inundated area also increases from 284.15 ha during the 25-year flood event to 306.19 ha during the 100-year flood event, indicating that larger floods not only extend the floodplain inundation but also intensify flood hazard conditions. This trend reflects the increasing influence of higher flow depths and velocities during extreme flood events, resulting in a greater proportion of the flood plain being exposed to elevated flood hazards.
 |
|
(a) |
 |
|
(b) |
Figure 17. Flood Hazard Affected Area for different flood events for initial river geometry (without considering riverbed aggradation and degradation). (a) Graphical plot; (b) Tabular representation.
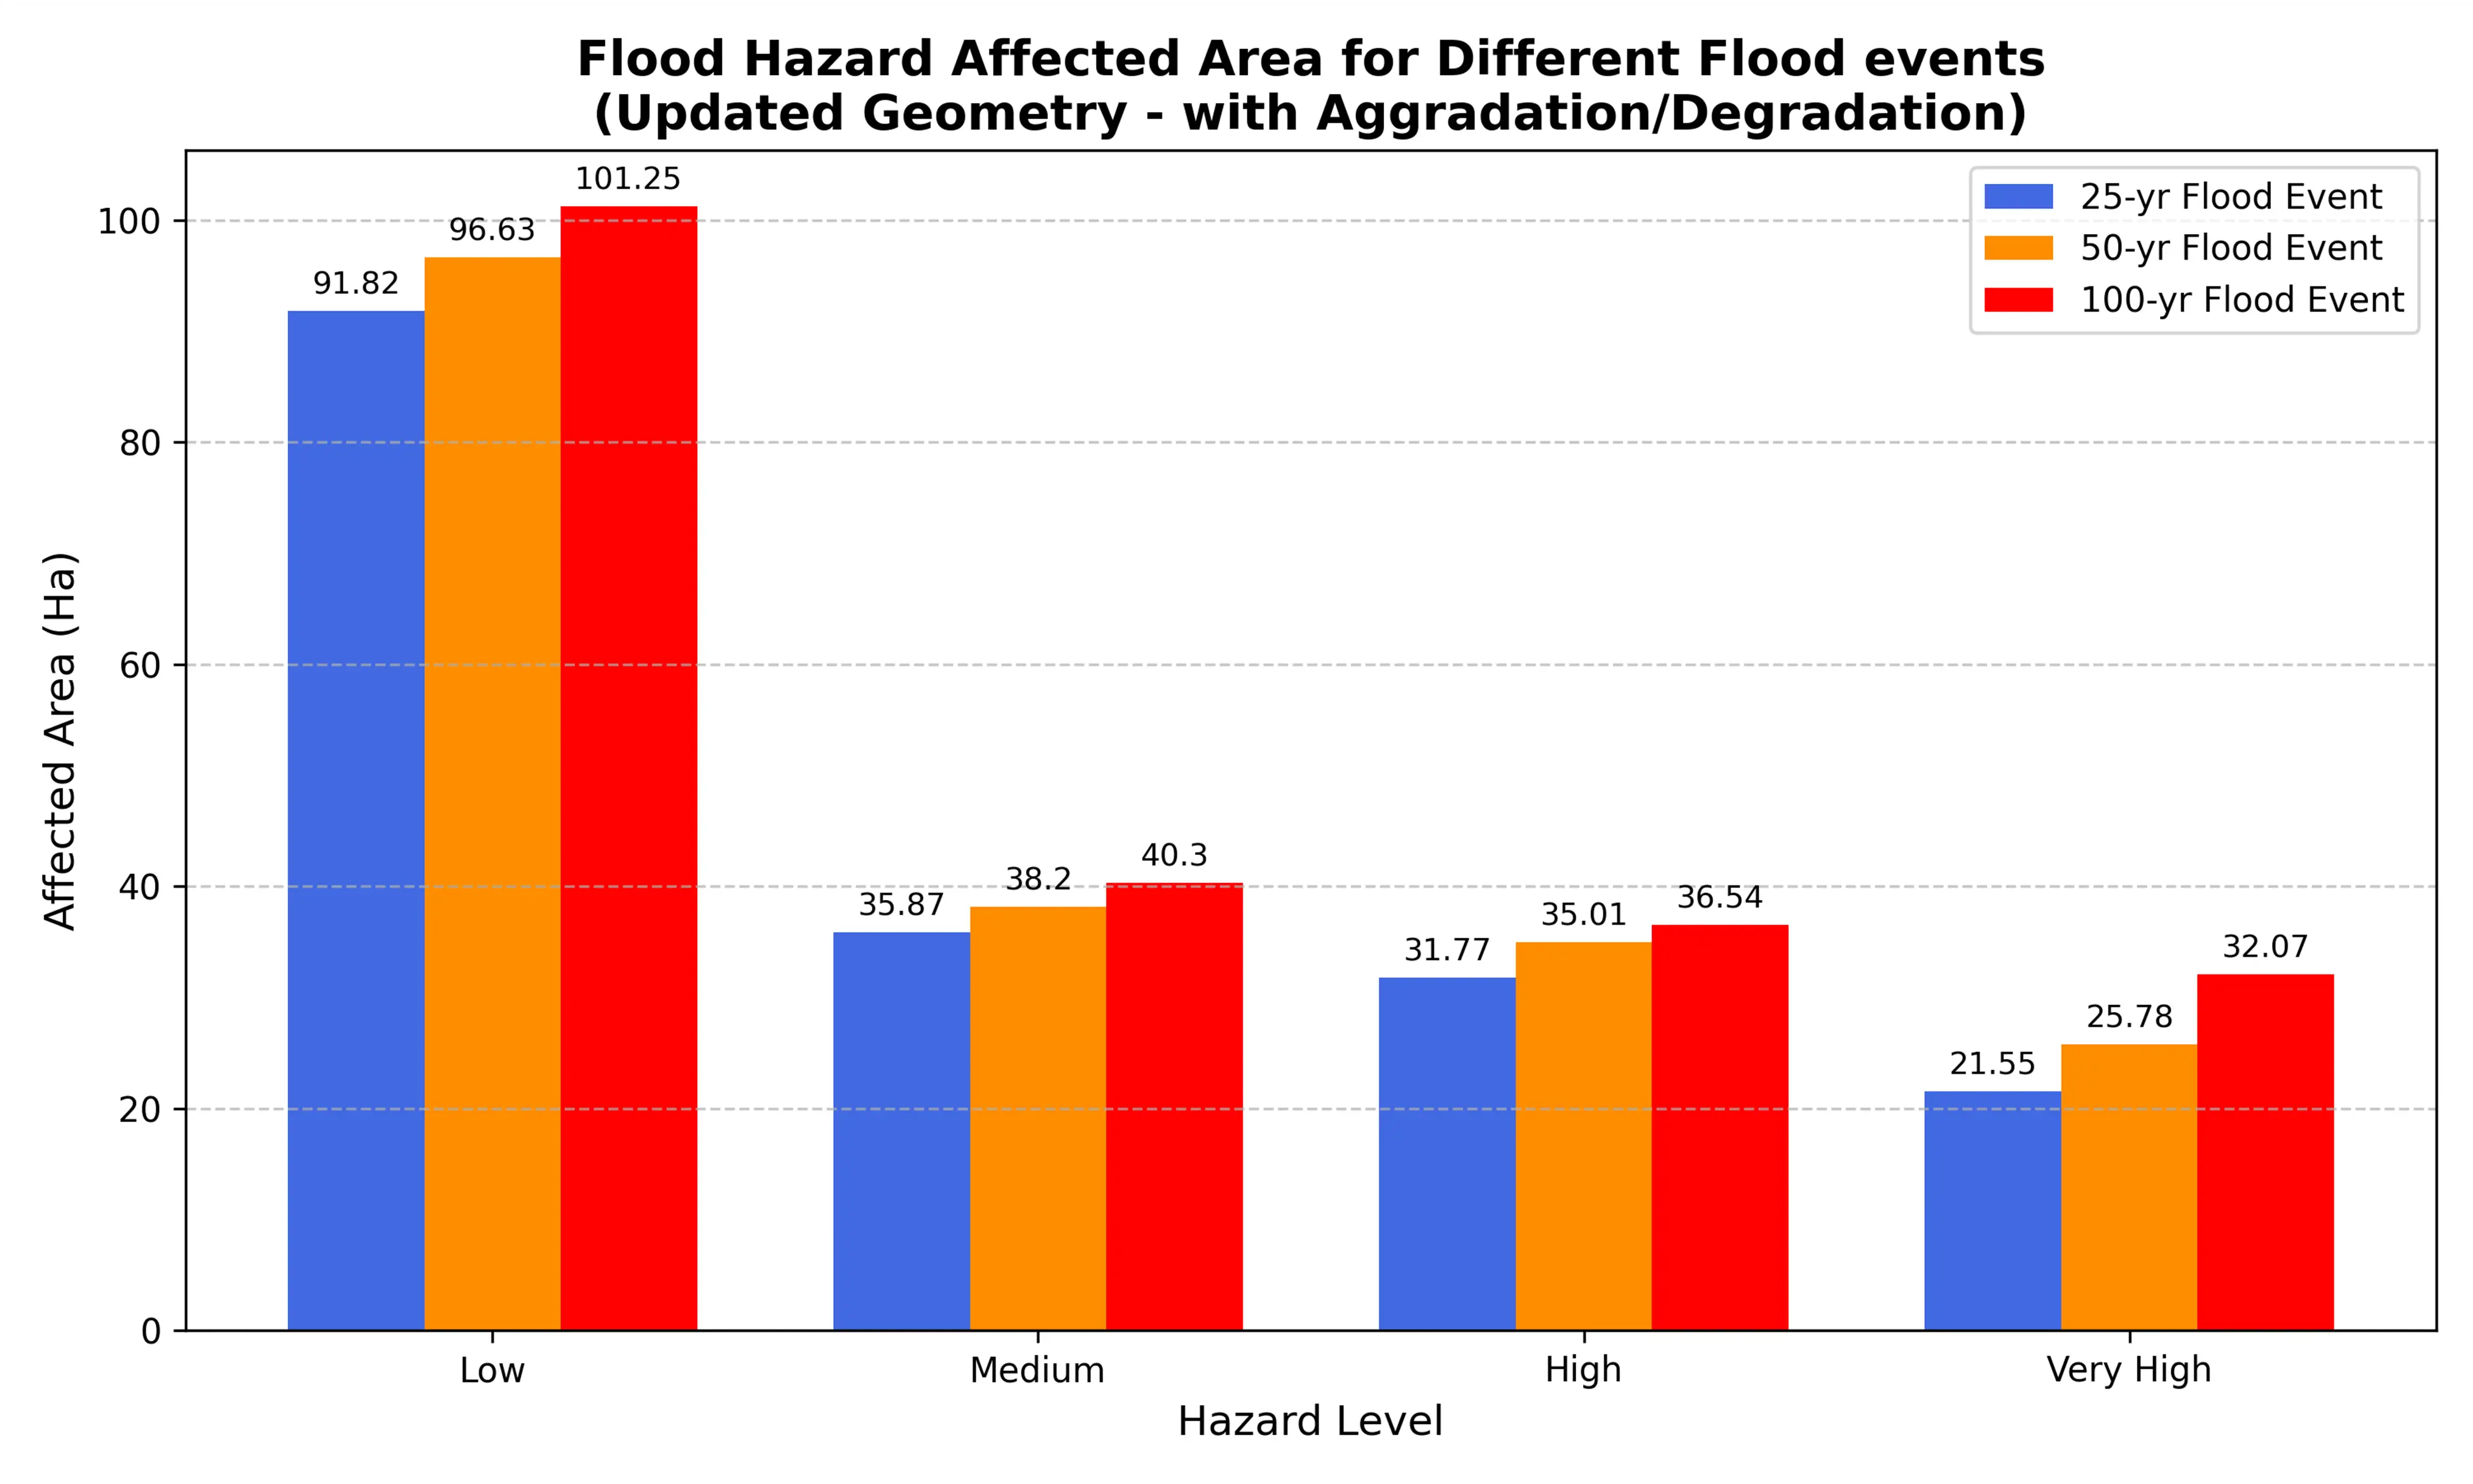
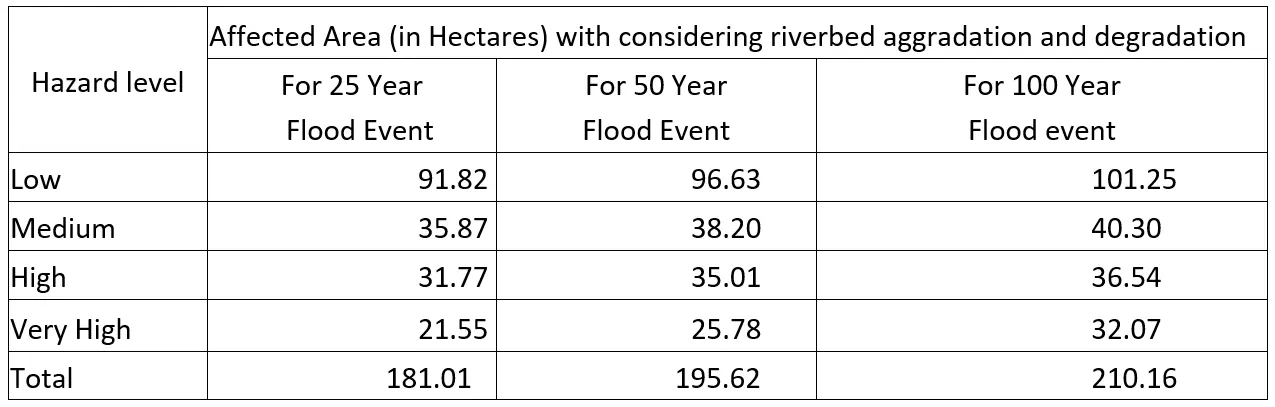
Figure 18a illustrates a graphical plot, and Figure 18b shows a tabular representation of the area affected under various hazard levels and various flood events, considering the case when the impact of river bed aggradation and degradation is considered. It highlights the influence of riverbed aggradation and degradation on flood hazard distribution across different return periods. As flood magnitude increases, a noticeable enlargement of the high and very high hazard zones can be observed, even though the low hazard class remains the most extensive category. The increasing proportion of areas falling within higher hazard classes suggests that riverbed changes enhance the severity of flooding by altering hydraulic conditions within the channel and adjacent floodplain. Consequently, floodwaters extend over a wider area and pose more hazardous conditions during longer-period events.
 |
|
(a) |
 |
|
(b) |
Figure 18. Flood hazard area for different flood events for updated river geometry (considering riverbed aggradation and degradation). (a) Graphical plot; (b) Tabular representation.
Figure 19 compares the extent of the very high hazard zone for different flood return periods with and without considering riverbed aggradation and degradation. The results show a substantial increase in the area classified under the very high hazard category when riverbed morphological changes are incorporated into the analysis. For the 25-, 50-, and 100-year flood events, the affected area increases from 4.39 ha, 5.55 ha, and 8.54 ha under static riverbed conditions to 21.60 ha, 25.80 ha, and 32.10 ha, respectively. The increase is approximately three to five times greater than that observed in the static scenario, highlighting the significant influence of riverbed aggradation and degradation on flood hazard severity. Furthermore, the magnitude increase becomes more pronounced with increasing return periods, indicating that riverbed morphological changes amplify the impacts of larger flood events and contribute to the expansion of areas exposed to severe flood hazards. Hazard map for 50 yr return period flood event for the case without considering riverbed aggradation and degradation and with consideration of riverbed aggradation and degradation are shown in Figure 20 and Figure 21.
The flood hazard results presented in Figure 17, Figure 18 and Figure 19 are the outcome of the integrated modelling framework illustrated in Figure 4 and Figure 5. In this workflow, discharge and sediment series for the ungauged Bakra River Basin were first generated through SWAT-based donor-basin regionalization, whereby a calibrated and validated hydrological model from the gauged Kankai River Basin was transferred to the study basin. The simulated sediment series was subsequently used in the HEC-RAS sediment model to predict long-term riverbed aggradation and degradation, producing an updated channel geometry. Hydraulic simulations and flood hazard mapping were then performed using both the original and updated river geometries, enabling direct evaluation of the influence of riverbed evolution on flood hazard characteristics. In contrast, Pandit and Bhattarai [9] conducted hydrological analysis for the ungauged Kamala River Basin using the Snyder Unit Hydrograph method, in which design flood hydrographs were derived from rainfall-frequency analysis and used directly as upstream boundary conditions in a HEC-RAS hydraulic model. Their flood hazard maps were subsequently generated by classifying inundation depths into hazard categories. The results indicated that flood hazard increased with return period, with high-hazard zones occupying the largest proportion of the affected area. While their approach successfully quantified flood hazards associated with different flood magnitudes, it assumed a fixed channel geometry throughout the analysis and therefore did not account for the influence of long-term riverbed changes on flood behavior. By contrast, the present study coupled hydrological modelling, sediment transport simulation, hydraulic analysis, and hazard mapping within a single framework, allowing comparison between static and morphologically adjusted channel conditions. The substantial increase in very high hazard areas observed after incorporating riverbed aggradation and degradation demonstrates that neglecting channel evolution may underestimate flood hazard severity. Consequently, this study addresses an important gap in previous flood hazard assessments by explicitly incorporating river morphology into the evaluation of flood risk in an ungauged river system, thereby providing a more physically realistic representation of future flood hazards.
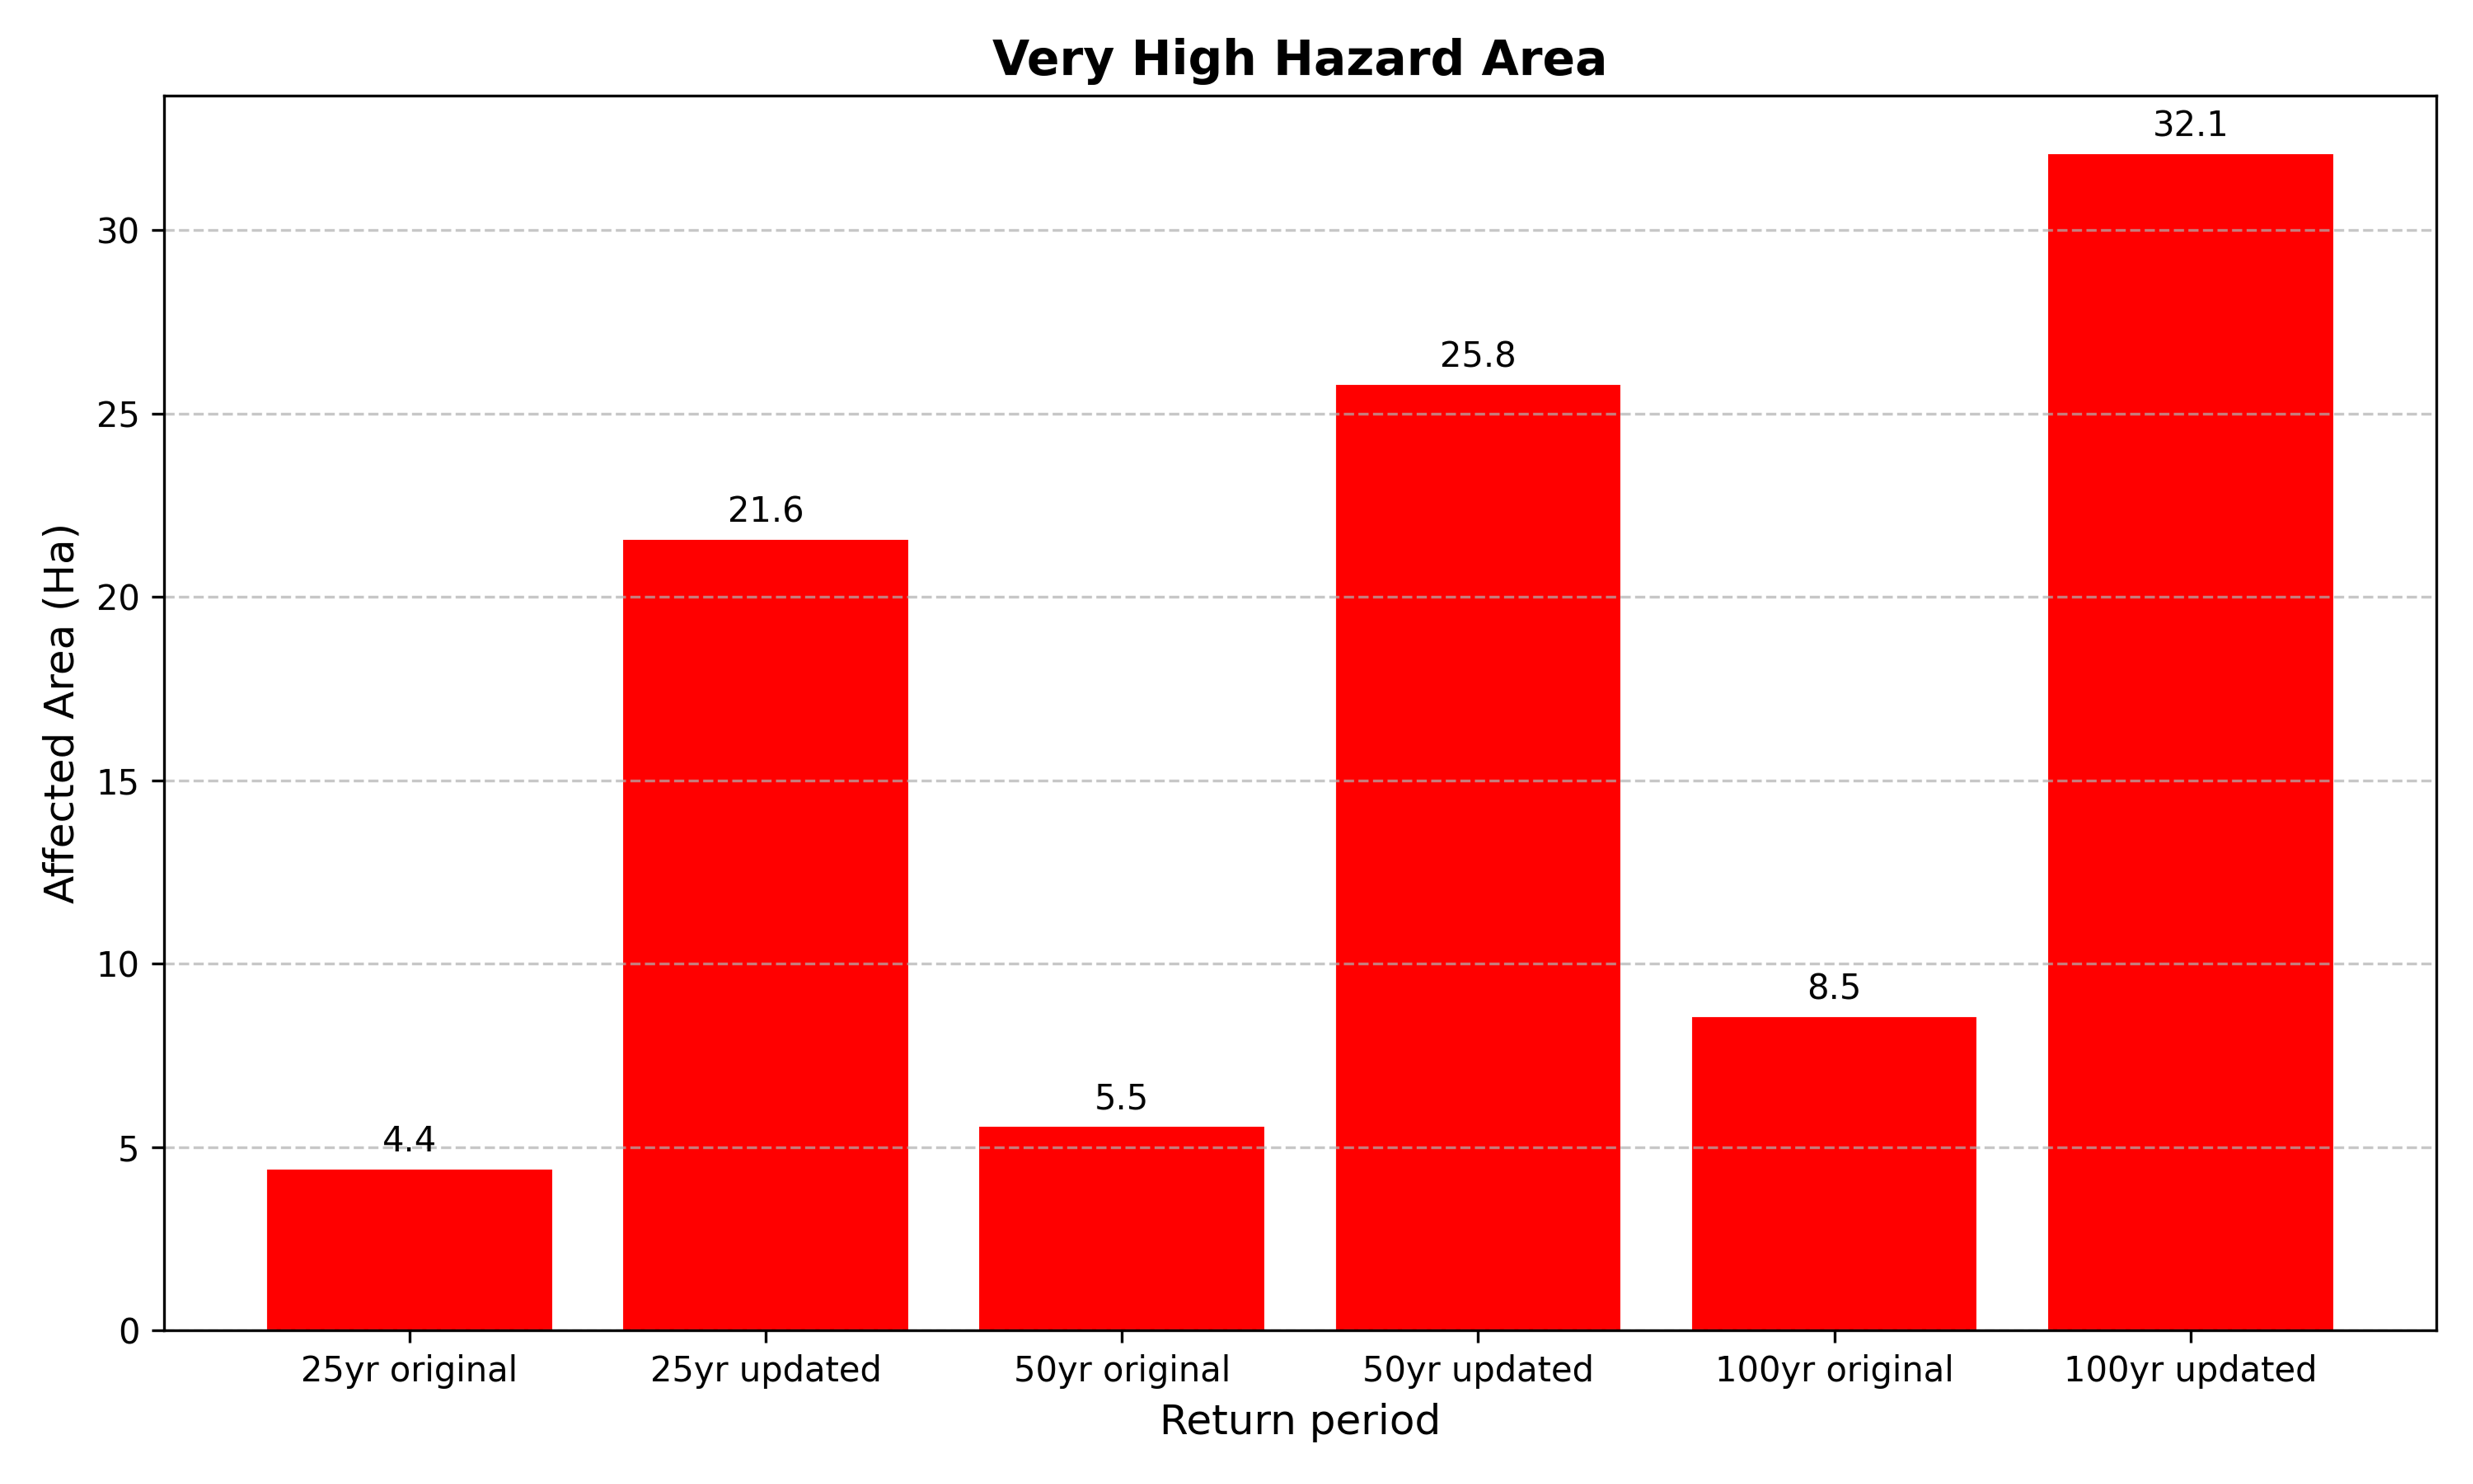
Figure 19. Comparison of affected areas under very high hazard class for various return periods for the case of without and with considering riverbed aggradation and degradation.

Figure 20. Hazard map and corresponding plot for 50 years return period when the impact of riverbed aggradation and degradation is not considered.

Figure 21. Hazard map and corresponding plot for 50-year return when the impact of riverbed aggradation and degradation is considered.
5. Conclusions
5.1. Key Findings
This study assessed the impact of long-term riverbed aggradation and degradation on flood inundation characteristics and flood hazard distribution in the ungauged Bakra River Basin through an integrated SWAT–HEC-RAS modeling framework. The SWAT model demonstrated satisfactory performance in the donor Kankai River Basin, achieving NSE values of 0.77 and 0.78 and R2 values of 0.79 and 0.83 during calibration and validation, respectively. The calibrated parameter set was subsequently transferred to the Bakra River Basin to generate runoff and sediment inputs under ungauged conditions. Using these inputs, the HEC-RAS sediment model simulated 41 years of morphological evolution and revealed substantial riverbed adjustments, with maximum aggradation and degradation reaching approximately +2.1 m and −4.0 m, respectively. The results indicate that long-term sediment transport processes significantly modify channel geometry and hydraulic characteristics, leading to noticeable changes in flow conveyance capacity, velocity distribution, and water-surface profiles along the river reach.
The hydrodynamic and flood hazard analyses further demonstrated that riverbed morphological changes play a critical role in controlling flood behavior. Although the overall inundation extent decreased after incorporating aggradation and degradation effects into the hydraulic model, flood hazard severity increased considerably. The area classified under the very high hazard category increased from 4.39 ha to 21.55 ha for the 25-year return period, from 5.55 ha to 25.78 ha for the 50-year return period, and from 8.54 ha to 32.07 ha for the 100-year return period. These findings suggest that sediment-induced channel adjustments can substantially alter the spatial distribution and intensity of flood hazards, even when the total flooded area is reduced. Therefore, flood assessments based solely on static channel geometry may underestimate localized flood risks in sediment-prone river systems. Overall, the study highlights the necessity of incorporating riverbed evolution processes into flood inundation modeling to improve the reliability of flood hazard assessment and support sustainable river basin management in ungauged watersheds.
5.2. Recommendations
The results demonstrate that flood management in the Bakra River Basin should account for long-term riverbed aggradation and degradation, as sediment-driven morphological changes substantially influence flood hazard patterns. The HEC-RAS sediment simulations identified localized aggradation near 1200 m and significant degradation near 500 m and 4000 m along the study reach. Therefore, aggrading sections should be managed through periodic dredging, sediment retention measures, and channel training works to maintain channel capacity, while degrading reaches require grade-control structures, bank stabilization, and scour protection to limit excessive erosion and infrastructure instability. Special attention is required at the bridge crossings located near 960 m and 3960 m, where riverbed changes produced localized increases in water levels and may affect hydraulic performance. Regular monitoring of channel cross-sections, bridge foundations, and riverbed conditions is recommended to support adaptive river management. In addition, the very high hazard zones identified in this study should be prioritized for flood risk reduction. Since consideration of riverbed evolution increased the very high hazard area by approximately three to five times compared with the static-channel condition, development within these zones should be carefully regulated. Structural measures such as embankments, gabion revetments, riprap protection, and river training works should be combined with non-structural approaches, including early-warning systems, evacuation planning, and community preparedness programs, to enhance long-term flood resilience in the Bakra River Basin.
5.3. Limitations
The findings of this study should be interpreted in light of several limitations. The Bakra River is an ungauged watershed where observed discharge, sediment transport, and historical flood records are unavailable. As a result, hydrological and sediment simulations relied on parameter transfer from a hydrologically similar donor catchment, introducing an unavoidable degree of uncertainty into the modeling framework. In addition, hydraulic analyses were performed using a one-dimensional (1D) HEC-RAS model, which may not fully represent complex flow patterns and floodplain interactions that occur during extreme flood events.
Another important limitation relates to the sediment modeling component. Owing to the lack of long-term field observations, including repeated cross-sectional surveys, sediment transport measurements, and historical records of channel morphology, comprehensive calibration and validation of the sediment model were not possible. Since morphodynamic simulations are highly sensitive to channel geometry and sediment characteristics, the absence of such datasets restricts direct verification of the predicted aggradation and degradation trends. Furthermore, the long-term morphological assessment was based on a single 41-year flow series generated from SWAT simulations. Although this approach provides a reasonable representation of basin hydrology, it may not encompass the full range of hydrological variability and uncertainty that could influence future channel evolution. Moreover, potential climate change impacts on precipitation regimes, runoff generation, sediment yield, and river morphology were beyond the scope of the present study. Despite these limitations, the integrated SWAT–HEC-RAS framework provides a useful first-order assessment of the influence of riverbed aggradation and degradation on flood inundation and hazard distribution in the ungauged Bakra River Basin, offering valuable insights for flood-risk management in data-scarce environments.
5.4. Future Works
Future work should focus on reducing the uncertainties identified in the present study and improving the representation of river morphodynamics and flood processes. A collection of long-term field data, including repeated cross-sectional surveys, sediment transport measurements, bed material characteristics, and observations of channel morphology, would enable more rigorous calibration and validation of sediment transport models and improve confidence in predicted riverbed changes. Future studies should also investigate multiple hydrological scenarios rather than relying on a single long-term flow sequence. Synthetic flow series representing different hydrological conditions and uncertainty ranges could be generated and applied within the sediment model to evaluate a wider spectrum of possible riverbed responses. Such an approach would allow identification of the most critical aggraded and degraded channel configurations and provide a more robust basis for flood hazard assessment under uncertain future conditions. In addition, the application of two-dimensional (2D) or coupled 1D–2D hydraulic models is recommended to better represent floodplain flow dynamics and channel–floodplain interactions. The use of high-resolution topographic datasets, such as LiDAR-derived DEMs, would further improve the accuracy of inundation mapping. Future investigations should also incorporate climate change projections to evaluate how changes in precipitation patterns, flood frequency, sediment yield, and river morphology may influence future flood hazards. Integrating climate change impacts with riverbed evolution modelling would provide a more comprehensive framework for long-term flood risk assessment and sustainable river basin management.
Statement of the Use of Generative AI and AI-Assisted Technologies in the Writing Process
During the preparation of this manuscript, the authors used OpenAI to improve readability and grammatical clarity. After using this tool/service, the authors reviewed and edited the content as needed and take full responsibility for the content of the published article.
Acknowledgments
The authors are grateful to the Purwanchal Engineering Campus, Dharan for providing material support in the production of this article.
Author Contributions
Conceptualization, S.K.Y. and S.K.; Methodology, S.K.Y. and A.D.; Software, S.K.Y.; Validation, S.K.Y., A.D. and S.K.; Formal Analysis, S.K.Y.; Investigation, S.K.Y.; Resources, S.K.Y.; Data Curation, S.K.Y.; Writing—Original Draft Preparation, S.K.Y. and A.P.; Writing—Review & Editing, S.K.Y., S.K. and A.P.; Visualization, S.K.Y. and S.K.; Supervision, A.D.
Ethics Statement
Not applicable.
Informed Consent Statement
Not applicable.
Data Availability Statement
All data used in the study are available on public websites, and the links are provided in the data section of the manuscripts.
Funding
This research received no external funding.
Declaration of Competing Interest
The authors declare that they have no known competing financial interests or personal relationships that could have appeared to influence the work reported in this paper.
References
- Parajuli A, Parajuli R, Banjara M, Bhusal A, Dahal D, Kalra A. Application of Machine Learning and Hydrological Models for Drought Evaluation in Ungauged Basins Using Satellite-Derived Precipitation Data. Climate 2024, 12, 190. DOI:10.3390/cli12110190 [Google Scholar]
- Aryal D, Wang L, Adhikari TR, Zhou J, Li X, Shrestha M, et al. A Model-Based Flood Hazard Mapping on the Southern Slope of Himalaya. Water 2020, 12, 540. DOI:10.3390/w12020540 [Google Scholar]
- Chafjiri AS, Gheibi M, Chahkandi B, Eghbalian H, Waclawek S, Fathollahi-Fard AM, et al. Enhancing Flood Risk Mitigation by Advanced Data-Driven Approach. Heliyon 2024, 10, e37758. DOI:10.1016/j.heliyon.2024.e37758 [Google Scholar]
- Maharjan M, Timilsina S, Ayer S, Singh B, Manandhar B, Sedhain A. Flood Susceptibility Assessment Using Machine Learning Approach in the Mohana-Khutiya River of Nepal. Nat. Hazards Res. 2024, 4, 32–45. DOI:10.1016/j.nhres.2024.01.001 [Google Scholar]
- Nagamani K, Mishra AK, Meer MS, Das J. Understanding Flash Flooding in the Himalayan Region: A Case Study. Sci. Rep. 2024, 14, 7060. DOI:10.1038/s41598-024-53535-w [Google Scholar]
- Nepal Disaster Report Focus on Reconstruction and Resilience (September 2024)—Nepal|ReliefWeb. Available online: https://reliefweb.int/report/nepal/nepal-disaster-report-focus-reconstruction-and-resilience-september-2024 (accessed on 31 May 2026).
- Priest SJ, Suykens C, Van Rijswick HFMW, Schellenberger T, Goytia S, Kundzewicz ZW, et al. The European Union Approach to Flood Risk Management and Improving Societal Resilience: Lessons from the Implementation of the Floods Directive in Six European Countries. Ecol. Soc. 2016, 21, 50. DOI:10.5751/ES-08913-210450 [Google Scholar]
- Basnet K, Acharya D. Flood Analysis at Ramghat, Pokhara, Nepal Using HEC-RAS. Tech. J. 2019, 1, 41–53. DOI:10.3126/tj.v1i1.27591 [Google Scholar]
- Pandit B, Bhattarai P. Flood Risk Mapping of Kamla River Basin Using HEC-RAS 2D Model. Adv. Eng. Technol. 2023, 3, 31–45. DOI:10.3126/aet.v3i1.60620 [Google Scholar]
- Dahal A, Bhattarai PK, Maharjan S. Analyzing the Future Flooding and Risk Assessment under CMIP6 Climate Projection Using HEC-HMS and HEC-RAS 2D Modelling of Babai River Basin. In Proceedings of the 12th IOE Graduate Conference, Kathmandu, Nepal, 19–22 October 2022. [Google Scholar]
- Tamang S, Bhattarai P. Flood Hazard Mapping of West Rapti and Assessing Impact on Agricultural Production in Dang District Using HEC-RAS 2D. In Proceedings of the 13th IOE Graduate Conference, Dharan, Nepal, 6–8 April 2023. [Google Scholar]
- Shrestha R, Pandey VP. Flood Hazard Mapping in Ungauged Chandi River Catchment. In Proceedings of the 14th IOE Graduate Conference, Lalitpur, Nepal, 29 November–1 December 2023. [Google Scholar]
- Niraula S, Shakya NM. Study on Flood Inundation Mapping for Ratuwa River Catchment Using HECRAS 2D. In Proceedings of 8th IOE Graduate Conference; Tribhuvan University: Lalitpur, Nepal, 2020. [Google Scholar]
- Upadhyaya BR, Gajurel AP, Thapa PB, Bhattarai RR, Dhital MR. Flood Hazard Modelling Using HEC-RAS in the Pathariya Khola, Far-Western Nepal. J. Nepal Geol. Soc. 2023, 66, 119–130. DOI:10.3126/jngs.v66i01.57957 [Google Scholar]
- Sarchani S, Seiradakis K, Coulibaly P, Tsanis I. Flood Inundation Mapping in an Ungauged Basin. Water 2020, 12, 1532. DOI:10.3390/w12061532 [Google Scholar]
- Khanal P, Paudel S, Neupane R, Adhikari S, Shrestha P, Regmi RK, et al. Dam Break Analysis of the Nagmati and Dhap Dams Using HEC-RAS. H2Open J. 2025, 8, 139–156. DOI:10.2166/h2oj.2025.058 [Google Scholar]
- Thapa S, Sinclair HD, Creed MJ, Borthwick AGL, Watson CS, Muthusamy M. Sediment Transport and Flood Risk: Impact of Newly Constructed Embankments on River Morphology and Flood Dynamics in Kathmandu, Nepal. Water Resour. Res. 2024, 60, e2024WR037742. DOI:10.1029/2024WR037742 [Google Scholar]
- Pender D, Patidar S, Hassan K, Haynes H. Method for Incorporating Morphological Sensitivity into Flood Inundation Modeling. J. Hydraul. Eng. 2016, 142, 04016008. DOI:10.1061/(ASCE)HY.1943-7900.0001127 [Google Scholar]
- Basnet K, Acharya D, Bhandari KP, Lamichhane S, Sadadev BB. Floodplain Mapping of an Ungauged River: A Case Study on Seti River in Pokhara, Nepal. Himalayan J. Appl. Sci. Eng. 2024, 4, 23–39. DOI:10.3126/hijase.v4i2.62185 [Google Scholar]
- Pender D. Incorporating River Bed Level Changes into Flood Risk Modelling. Available online: http://www.iahr.org/library/infor?pid=7848 (accessed on 31 May 2026).
- Prakash KC, Baral S, Mishra B, Timilsina I. Experimental and Numerical Simulations of Sediment in Fusre River Basin, Nepal. Himal. J. Appl. Sci. Eng. 2022, 3, 39–52. DOI:10.3126/hijase.v3i1.48254 [Google Scholar]
- Maharjan S, Yadav A, Shakya NM. Sediment Simulation and Impact of Land Cover Changes Using SWAT Model in Karnali Basin. In Proceedings of 8th IOE Graduate Conference; Tribhuvan University: Lalitpur, Nepal, 2020. [Google Scholar]
- Kurbah S, Jain MK. North Eastern Space Applications Centre, Shillong Rainfall-Runoff Modeling of a River Basin Using SWAT Model. IJERT 2017, V6, IJERTV6IS120111. Available online: https://www.ijert.org/research/rainfall-runoff-modeling-of-a-river-basin-using-swat-model-IJERTV6IS120111.pdf (accessed on 6 March 2026).
- Karki M, Khadka DB. Simulation of Rainfall-Runoff of Kankai River Basin Using SWAT Model: A Case Study of Nepal. Int. J. Res. Appl. Sci. Eng. Technol. 2020, 8, 308–326. DOI:10.22214/ijraset.2020.30867 [Google Scholar]
- Yesuf HM, Assen M, Alamirew T, Melesse AM. Modeling of Sediment Yield in Maybar Gauged Watershed Using SWAT, Northeast Ethiopia. Catena 2015, 127, 191–205. DOI:10.1016/j.catena.2014.12.032 [Google Scholar]
- Yuan L, Forshay KJ. Using SWAT to Evaluate Streamflow and Lake Sediment Loading in the Xinjiang River Basin with Limited Data. Water 2019, 12, 39. DOI:10.3390/w12010039 [Google Scholar]
- Arnold JG, Srinivasan R, Muttiah RS, Williams JR. Large Area Hydrologic Modeling and Assessment Part I: Model Development. J. Am. Water Resour. Assoc. 1998, 34, 73–89. DOI:10.1111/j.1752-1688.1998.tb05961.x [Google Scholar]
- 1D Sediment Transport User’s Manual. Available online: https://www.hec.usace.army.mil/confluence/rasdocs/rassed1d/1d-sediment-transport-user-s-manual (accessed on 31 May 2026).
- Islam MM, Rahman MA. Development of Flood Inundation Map for 100 Years Return Period Using HEC-RAS 2D. In Proceedings of the 6th International Conference on Civil Engineering for Sustainable Development (ICCESD 2022), Khulna, Bangladesh, 10–12 February 2022; p. 050005. [Google Scholar]
- Ali M, Raziq U, Qureshi A, Zaid M, Qaseem U, Ali U. Integrating SWAT and HEC-RAS Models for Enhanced Flood Risk Mapping in Swat River, KPK, Pakistan. Fusion J. Eng. Sci. 2025. DOI:10.64615/fjes.1.SpecialIssue.2025.58 [Google Scholar]
- Zhang X, Srinivasan R, Hao F. Predicting Hydrologic Response to Climate Change in the Luohe River Basin Using the SWAT Model. Trans. ASABE 2007, 50, 901–910. DOI:10.13031/2013.23154 [Google Scholar]
- Raj Adhikari T, Panthee S. Application of Hydrodynamic (HEC–RAS) Model for Extreme Flood Analysis in Far-West Province: A Case Study of Chamelia River Basin, Darchula District, Nepal. J. Geoinform. Nep. 2020, 19, 9–15. DOI:10.3126/njg.v19i1.50961 [Google Scholar]
- Asitatikie AN, Kifelew MS, Shumey EE. Flood Inundation Modeling Using HEC-RAS: The Case of Downstream Gumara River, Lake Tana Sub Basin, Ethiopia. Geocarto Int. 2022, 37, 9625–9643. DOI:10.1080/10106049.2021.2022014 [Google Scholar]
- Thiaw I. Water Resources Modeling in Data-Scarce Watersheds: Contribution of the SWAT Model and the SUFI2 Algorithm to the Study of the Thiokoye River Basin. GEP 2025, 13, 46–73. DOI:10.4236/gep.2025.136005 [Google Scholar]
- Dahal P, Shrestha ML, Panthi J, Pradhananga D. Modeling the Future Impacts of Climate Change on Water Availability in the Karnali River Basin of Nepal Himalaya. Environ. Res. 2020, 185, 109430. DOI:10.1016/j.envres.2020.109430 [Google Scholar]
- Jha M, Afreen S. Flooding Urban Landscapes: Analysis Using Combined Hydrodynamic and Hydrologic Modeling Approaches. Water 2020, 12, 1986. DOI:10.3390/w12071986 [Google Scholar]
- Bhattarai P, Khanal P, Tiwari P, Lamichhane N, Dhakal P, Lamichhane P, et al. Flood Inundation Mapping of Babai Basin Using HEC-RAS & GIS. J. Inst. Eng. 2019, 15, 32–44. DOI:10.3126/jie.v15i2.27639 [Google Scholar]
- Nepal S, Chandra GCK. Flood Inundation Mapping of Bagmati River and Impact Assessment on Building Infrastructures on Terai Plains of Nepal. J. Adv. Coll. Eng. Manag. 2024, 9, 95–104. DOI:10.3126/jacem.v9i1.71425 [Google Scholar]
- Hamidifar H, Nones M, Rowinski PM. Flood Modeling and Fluvial Dynamics: A Scoping Review on the Role of Sediment Transport. Earth-Sci. Rev. 2024, 253, 104775. DOI:10.1016/j.earscirev.2024.104775 [Google Scholar]
- Andualem TG, Hewa GA, Myers BR, Peters S, Boland J. Erosion and Sediment Transport Modeling: A Systematic Review. Land 2023, 12, 1396. DOI:10.3390/land12071396 [Google Scholar]
- Collins SL, Christelis V, Jackson CR, Mansour MM, Macdonald DMJ, Barkwith AKAP. Towards Integrated Flood Inundation Modelling in Groundwater-Dominated Catchments. J. Hydrol. 2020, 591, 125755. DOI:10.1016/j.jhydrol.2020.125755 [Google Scholar]
- Moriasi DN, Arnold JG, Van Liew MW, Bingner RL, Harmel RD, Veith TL. Model Evaluation Guidelines for Systematic Quantification of Accuracy in Watershed Simulations. Trans. ASABE 2007, 50, 885–900. DOI:10.13031/2013.23153 [Google Scholar]
- Dahal G, Regmi RK, Adhikari S. Optimization of Model Parameters of HEC-RAS 2D Model on Flood Inundation Mapping: A Case Study of Kankai River Basin. In Proceedings of 10th IOE Graduate Conference; Tribhuvan University: Lalitpur, Nepal, 2021. [Google Scholar]
- Pathan AKI, Agnihotri PG. 2-D Unsteady Flow Modelling and Inundation Mapping for Lower Region of Purna Basin Using HEC-RAS. Nat. Environ. Pollut. Technol. 2020, 19, 277–285. Available online: http://neptjournal.com/upload-images/(28)B-3622.pdf (accessed on 6 March 2026).
- Shahi T, Regmi RK, Neupane YS, Baniya R. Applicability of the SWAT Model in Medium-Sized River Basins of Nepal: A Case Study of East Rapti and Kankai River Basin. J. Adv. Coll. Eng. Manag. 2025, 11, 203–219. DOI:10.3126/jacem.v11i1.84540 [Google Scholar]
- Mosavi A, Golshan M, Choubin B, Ziegler AD, Sigaroodi SK, Zhang F, et al. Fuzzy Clustering and Distributed Model for Streamflow Estimation in Ungauged Watersheds. Sci. Rep. 2021, 11, 8243. DOI:10.1038/s41598-021-87691-0 [Google Scholar]