1. Introduction
In 2015, the world embarked on a new development agenda based on the Sustainable Development Goals (SDGs). Achieving these goals requires integrated action on social, environmental and economic challenges, with a focus on inclusive, participatory development that leaves no one behind. In March 2017, the United Nations Statistical Commission adopted the measurement framework for the UN 2030 Agenda for Sustainable Development, which consists of 232 indicators designed to measure the 17 SDGs and their respective 169 targets [
1]. These universal goals are integrated and indivisible and balance the three dimensions of sustainable development pillars: economic, social, and environment. One of the most important aspects of the sustainable development goals (SDGs) agenda is the emphasis on the development of objective targets and scientifically based indicators for each of the SDGs in order to monitor progress, implement strategies, allocate resources and enhance stakeholder accountability.
Data is the lifeblood of decision-making and the raw material of accountability. Today, big data analytics are commonplace in the private sector, with consumer profiling, personalized services, and predictive analytics used for marketing, advertising and management. Similar techniques can be employed to understand people’s well-being in real time and to target assistance to vulnerable groups. New sources of data (e.g., satellite data), new technologies and new analytical methods, if applied responsibly, can make decision-making more flexible, efficient and evidence-based, and can better measure progress towards the Sustainable Development Goals (SDGs) in a way that is both inclusive and equitable [
2]. The private sector collects much of the big data that is most likely to be used for the public good. As a result, public-private partnerships are likely to become more common. The challenge will be to ensure that these partnerships are sustainable in the long term and that a clear framework is established to clarify the roles and expectations of each party [
2]. As centers of global economic growth and environmental change, cities are becoming increasingly important in achieving sustainable development. It is currently projected that more than two thirds of the population will live in cities by 2050 [
3]. Contributing to around 80% of the global gross domestic product (GDP), cities are not only powerhouses of economic activity but also crucibles of innovation and cultural development [
4].
The emergence of big data is increasingly recognized as having a significant impact on cities [
5]. The predictive analytics associated with these innovations can potentially empower people and change how urban dwellers interact with each other, their surroundings and urban infrastructure. Urban Big Data stems from the increasing availability of everyday data we generate in our urban environments. These include, for example, data associated with urban sensors such as the Internet of Things (IoTs), administrative records, individual- or household-level survey data, geospatial imagery, business information, citizen science (defined as scientific data collection and analysis conducted voluntarily by the general public), and social media. These data are critical for filling gaps in existing sustainability assessment tools and indicators [
6].
Japan faces a sharp population decline and extreme population aging, most prominently in local municipalities, and “regional revitalization” has been a priority national strategy. Thus, SDGs in Japan are strongly linked to the sustainability of rural economies and regional revitalization [
7]. As one of the 4 pillars of the SDGs Action Plan 2021, the second pillar aims to accelerate the efforts to materialize the Society 5.0 (Society 5.0 is regarded as “a human-centered society that balances economic advancement with the resolution of social problems by a system that highly integrates cyberspace and physical space.”), and to promote digital transformation for a “new normal” where everyone can benefit from digitization. It also stresses the need to promote Science, technology and innovation (STI) to solve societal problems and achieve a sustainable, circular society as required by the SDGs [
7].
Kurashiki City was selected as an “SDGs Future City” by the national government (Cabinet Office) in 2020, to comprehensively address a wide range of economic, social, and environmental issues. At the same time, Kurashiki was also selected as a “Municipal SDGs Model Project” as a leading initiative among SDGs Future Cities, which is expected to create a self-sustaining virtuous circle in the region through cooperation with various stakeholders [
8,
9].
Definition, Significance and Source of Big Data
There are challnges to defining big data, while some argue that it is ‘an inherently vague concept’, it is important to try and define it [
10]. However, it is important to explain to readers that big data is not simply ‘lots of data’ and that, despite the name ‘big data’, size is not the defining feature. So, if not size, what makes big data big? One of the challenges in trying to answer this question is that there is no rigorous definition of “big data” [
11]. But we can generalize the characteristics of Big Data and define it by its features and source. In this chapter, we define big data respectively on a global scale and Japan national scale.
On a global scale, since the invention of the computer, vast amounts of data have been generated at rapid speeds. This condition is a key driving force for current and future research frontiers. Advancements in mobile devices, digital sensors, communications, computation, and storage offer means to gather data. According to statistics from the renowned IT company Industrial Development Corporation, the global data volume grew ninefold in five years [
12,
13]. Various explanations have been provided to define big data from 3V—Volume, Variety, and Velocity to 4V—Volume, Velocity, Variety, and Veracity. Doug Laney described big data through the three V’s: volume, velocity, and variety. The term “volume” refers to the size of the data, “velocity” to the speed of incoming and outgoing data, and “variety” describes the sources and types of data. In 2017, Hammer et al. chose the 5V definition (original 3V plus two other Vs—veracity, and variability). Veracity refers to noise and bias in the data. Variability refers to “the changing technological or business environment that generates Big Data, which can lead to ineffective analyses and results, such as the vulnerability of Big Data as a data source”. Arguably, however, the 6V definition, which includes “value”, provides a better definition, where value means deriving something useful from the data, as it introduces the concept of cost-effectiveness, where the cost of investing in a large enterprise must be carefully weighed against what the data may offer in practice. Value refers to the worth of insights hidden in big data. Generally, big data is a collection of vast, complex data sets that cannot be effectively managed through the most advanced data processing techniques [
13]. We can view big data as the collective noun for all the new digital data produced from our digital activities. Our everyday reliance on technology is leaving “digital footprints” everywhere. This digital data can be shared, cross-referenced, and repurposed in unprecedented ways, opening numerous new statistical possibilities. Yet big data also presents massive statistical and governance challenges as well as potential pitfalls: legal, ethical, technical, and reputational. Big data also brings significant expectation management challenges, as many seem to mistakenly think that accessing big data is simple and that their use will automatically and significantly reduce the cost of generating statistical information [
14].
In Japan national scale: According to the 2017 White Paper on Information and Communications in Japan published by the Ministry of Internal Affairs and Communications (MIC), further progress in digitalization, advanced networks and IoT development through smaller and cheaper IoT devices such as smartphones and sensors are paving the way for us to efficiently collect and share big data including location information and action history provided through smartphones, information on Internet and television watching and consumption behaviors and massive data gained through miniaturized sensors. Big data has attracted attention in recent years particularly because data for distribution has expanded to cover not only traditional virtual (cyberspace) data in the ICT field but also real data provided through IoT development and new ICT tools, and business-to-consumer and business-to-business data. While various views exist about how to classify big data, this paragraph pays attention to data generated by individuals, business and government sectors. It classifies big data into the following four broad categories [
14,
15].
- (1)
-
Government: “National and Local Government Provided” Open Data: As big data, open data has been at the forefront. The Basic Law for Promoting the Utilization of Data in the Public and Private Sectors calls for public information owned by national and local governments to be vigorously opened up as data [16].
- (2)
-
Enterprises: Digitization and structuring of knowledge (called “digital intelligence): Digitized intelligence refers to data other than personal data held by industries or businesses ranging from agriculture to infrastructure management to business services. In the future, a wide range of know-how, accumulated knowledge in various fields and industries, and familiar personal intelligence will be digitized [16].
- (3)
-
Business: M2M (machine-to-machine) streaming data: M2M data includes data from IoT devices at production sites and sensing data (including strain, vibration, type and weight of passing vehicles) from IoT devices installed on bridges. From the perspective of information generation and utilization, M2M data and digital intelligence in (2:enterprises) are mainly positioned as industrial data. In particular, B2B data is expected to highlight Japan’s competitiveness and enhance industrial strength. In this chapter, digital intelligence and M2M data are collectively referred to as “industrial data” [16].
- (4)
-
Individuals: Personal Data “Involving Attributes”: Personal data includes personal attributes, movement/action/consumption records, wearable device data, and other personal information, as well as footfall and product information that has been processed to prevent the identification of a specific individual. Accordingly, this chapter interprets “personal data” to include not only personal information as expressly defined by law, but also other personal-related information similar to personal information as defined by law [16].
Based on the above, this paper adopts the definition provided in Japan’s 2017 White Paper on Information and Communications. Throughout this manuscript, “big data” refers to the four categories outlined therein: data from government (
i.e., open data), enterprises, M2M, and individuals. Our analysis will particularly focus on government-provided open data and personal data related to citizens. And the big data that appears in this paper falls under: government open data and individual personal data.
2. Research Approach
The approach used in this research is a mixed-method approach of quantitative and qualitative approach. A quantitative analysis is used to analyze the text of governmental documents and in-depth interview text, which aimed to distill patterns, recurring themes, and core insights from the narrative data. A qualitative description was applied to analyze the content of the interview contents and to develop a ‘Stakeholders Connection Framework’. This conceptual model is pivotal in systematically aligning stakeholder feedback with the overarching research questions, ensuring that each insight reflects the study’s tripartite objective.
This research unfolds in three main stages: first, an analysis of government documents concerning Kurashiki City’s SDGs Future City plan; second, an analysis of interview texts from 24 local stakeholders; and third, a synthesis and comparison of the findings from both analyses to identify the unique opportunities and challenges the city faces.
2.1. Data Analysis Method
2.1.1. Qualitative Interviews
To analyze the collected texts, this study utilizes the quantitative text analysis software KH Coder. The analysis of government documents included Frequency Analysis, Co-Occurrence Network Analysis, and Hierarchy Cluster Analysis to identify key policy priorities and conceptual structures. The analysis of the interview texts was conducted in a two-step process.
Step 1: Exploratory Analysis. An initial quantitative analysis consisting of Frequency Analysis, Co-Occurrence Network Analysis, and Correspondence Analysis was performed to objectively identify the main themes, stakeholder concerns, and the relationships between key concepts within the interview data.
Step 2: Focused Analysis. Based on the insights from Step 1, five core coding categories (datum, sdg, disaster prevention, city, people) were systematically established. A Cross-Tabulation Analysis was then conducted to examine the frequency of these codes across different stakeholder groups, revealing their varying points of focus.
The interviews were conducted in Japanese. During the 10 days of field research in Kurashiki City, interviews were conducted with total 24 people includes 11 citizens (who had experienced the Mabi flood in 2018), 6 government officials (working in the urban planning department of the Kurashiki City government), 4 NPO members (from two different NPOs, one providing psychological support to families of disabled children and the other providing local care visits, both having experienced the 2018 flood and provided assistance), and 4 members of private enterprises (these businesses are in joint ventures with the local government using big data and open data to provide services). The interviews were face-to-face, with each lasting approximately 45 min to 1 h.
The sample size of 24 participants was determined based on the key informant survey methodology, which aims to gather rich, relevant insights from a targeted group of knowledgeable individuals rather than achieving statistical generalization. The selection was purposefully structured to encompass diverse stakeholder perspectives, including citizens who experienced the 2018 Mabi flood, government officials from the urban planning department, NPO members involved in disaster support, and representatives from private enterprises engaged in data-driven collaborations with the local government. This composition was considered appropriate for capturing a comprehensive view of the opportunities and challenges related to the study’s objectives.
A different focus was taken for each stakeholder group, but the themes revolved around SDGs, data, and the application of big data technology. These themes were confirmed through the analysis of interview transcripts. Interviews were recorded with participant consent and transcribed in Japanese. They were all translated into English for analysis. The transcriber omitted any data that could lead to the identification of participant identities from the transcripts.
Interviews are an actively used research method in many fields. Researchers often cite parts of the interview and add their interpretations when analyzing and writing interview records. It is normal for qualitative analysis to have more weight. In this case, conducting quantitative text analysis in advance is useful for understanding the interviews and the differences between statements from multiple groups.
2.1.2. Quantitative Analysis
A total of 24 stakeholders were interviewed. As the purpose of this study was to gather relevant evidence through qualitative interviews with professionals in the community (key informant survey), a small sample size was used.
All interview transcripts were manually verified. The interview framework was set to capture participants’ experiences as broadly as possible. For each topic, a list of codes was created using English data text mining software (KH Coder version 3.Beta.03, updated on 7 September 2021, by Koichi Higuchi from Japan). Codes were based on the presence or absence of words corresponding to attribute information and specified coding rules. The analyst manually specified coding rules after manually extracting words through confirmation [
17].
Hierarchical clustering analysis and co-occurrence network analysis were performed, extracting high-frequency words and co-occurrence terms; the associations between words within sentences generated are visually represented on the co-occurrence network map. In hierarchical clustering, words appearing ≥15 times (the default setting in KH Coder) were clustered using the Ward method, and the Jaccard distance between clusters was calculated. In the co-occurrence network analysis, co-occurrence relationships were calculated through the Jaccard index for words and their combinations appearing ≥5 times, extracting up to 240 co-occurrence relationships as lines from the largest relationships.
3. Analysis of Data
3.1. Analysis of Governmental Document
To gain a comprehensive overview of the existing SDGs policies outlined by the Kurashiki City government. We use KH coder to conduct a content analysis consisting of Co-Occurrence Network analysis and Hierarchy Cluster Analysis.
A note on the analytical strategy for co-occurrence networks: For the initial exploratory analysis of the interview texts, we deliberately included a wide range of high-frequency words without creating an extensive stop-list of common words. This approach was chosen to capture an unfiltered, holistic view of the stakeholders’ discourse, allowing for the discovery of unexpected thematic connections. For example, when viewed in the network, words related to politeness or daily life can reveal important context about the nature of community interactions, particularly in discussions of disaster response and volunteer activities. While these words may not seem directly related to policy, they are part of the rich qualitative data that informs the overall interpretation. The subsequent, more focused quantitative analysis (e.g., the Cross-Tabulation Analysis in Step 2) relies on systematically defined coding categories, effectively filtering the data to address the core research questions. Therefore, the initial inclusive approach in the co-occurrence network is a foundational step for the more targeted analysis that follows.
- 1.
-
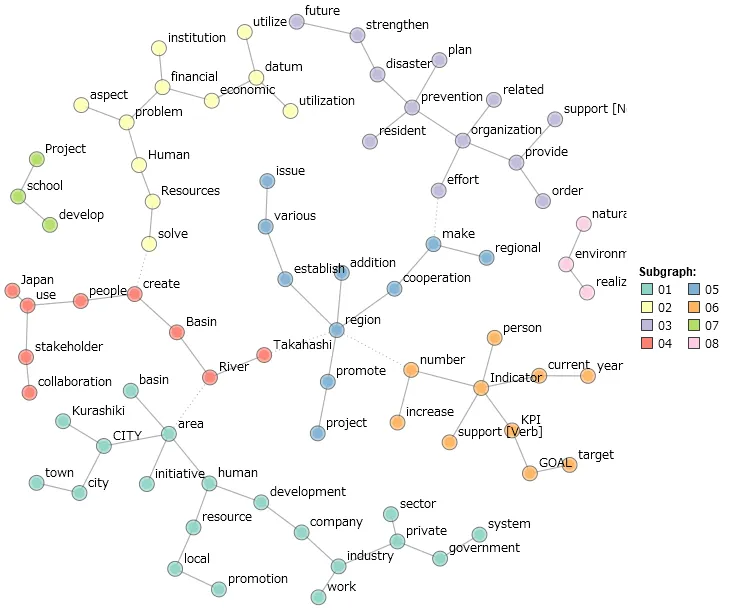
Co-Occurrence Network: Visualization of the relationships between key terms, revealing how different SDG-related concepts are interconnected within policy documents ().
. Co-Occurrence Network of government documents.
From what can be seen in the graph, terms like “Kurashiki”, “River”, “Takahashi”, and “Basin” are closely related, suggesting a focus on geographic and environmental aspects, which are related to water management or disaster response in the context of Kurashiki City. “Disaster”, “prevention”, “support”, and “resident” are also interconnected, indicating discussions about disaster prevention and response, as well as community support systems. “Collaboration” and “stakeholder” appear in proximity, alongside “Kurashiki” and “CITY”, which highlight discussions around stakeholder engagement in urban planning, policy-making and policy implementation in Kurashiki City. The term “datum” is linked to “utilization”, indicating discussion about using data, which would be in the context of data-driven decision-making or policy formulation.
- 2.
-
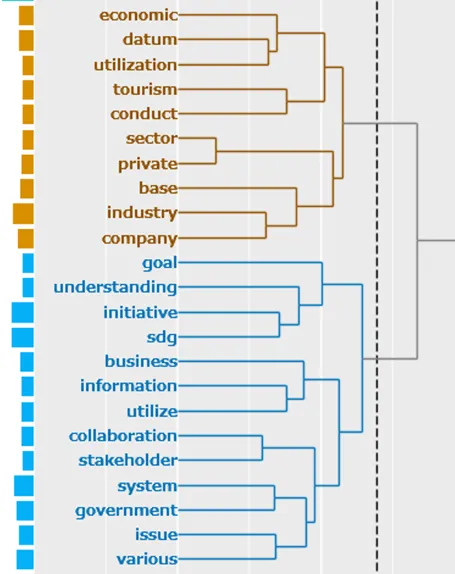
Hierarchy Cluster Analysis: indicating how different terms from the data set are grouped together based on their co-occurrence or similarity ().
Based on the structure of this dendrogram, terms that are most closely associated within my content analysis can be abstained.
. Hierarchy Cluster Dendrogram.
Terms like “Business”, “information”, “utilize” and “datum”, “economic”, “utilization”, joining at a lower point implies a strong relationship, which indicates discussions around the utilization of information and data in business and economic contexts. Terms like “economic”, “datum”, “utilization”, and “tourism” cluster together, pointing to economic aspects potentially discussed alongside data utilization, in the context of promoting tourism. This could be related to discussions on how big data can be used to boost economic development or tourism within the context of SDGs. The clustering of “sector”, “private”, and “industry” suggests a focus on the role of the private sector and industry in the broader discussion, in relation to their involvement in SDG efforts or data utilization. These terms connected with “government” and “system” indicate the public-private partnership between the government and the private sector. The term “datum” is quite distant from “SDG” but still connected in this part of the dendrogram, which indicates that discussions about data and SDGs are not as closely linked as one might expect. It shows the future direction of Kurashiki city.
3.2. Analysis of Interview Text
By analyzing interview text with KH Coder, insight about the prevalence of certain themes, the concerns of different stakeholders, and the areas of focus for future initiatives can be retrieved, which helps to understand complex issues like the big data implementation of SDGs or community responses to disaster prevention.
Step 1: We use the KH coder to conduct a content analysis consisting of Co-Occurrence Network analysis and Correspondence Analysis.
- 1.
-
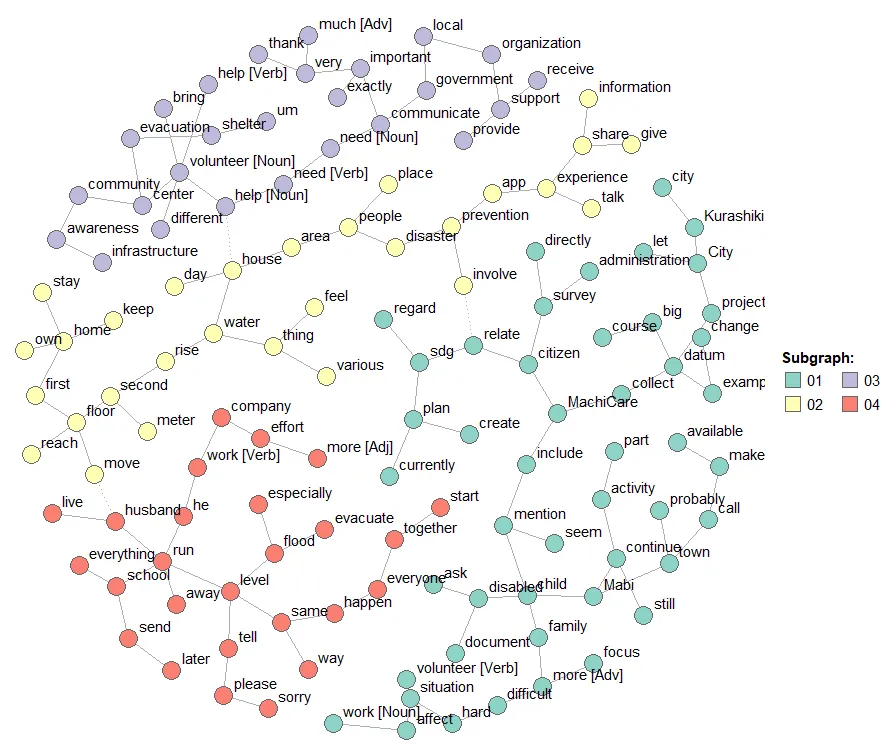
Co-Occurrence Network: Visualization of the relationships between key terms, providing a high-level overview of the relationships and thematic content within interview text, revealing how different key focal points are interconnected within different stakeholders.
From the word-word network in
, the terms “SDG”, “datum”, “big”, and “MachiCare” are mentioned together with “plan”, “project”, and “change”, indicating conversations about how big data and specific initiatives like MachiCare are related to the strategic planning and implementation of SDGs. The proximity of “community”, “volunteer”, “support”, “people”, and “house” suggests themes of community resilience, the role of volunteers, and how individuals support each other during times of crisis. The terms “Information”, “communicate”, “share”, and “tell” are clustered, which points to discussions about the importance of information sharing and communication, especially in the context of disaster response and community awareness. The grouping of “government”, “infrastructure”, “effort”, and “company” is related to discussions on public infrastructure, government efforts in development and disaster management, and public-private partnerships like corporate involvement.
. Words–words co-occurrence network of Interview Text.
A detailed co-occurrence network graph is shown in
, with nodes representing terms from the dataset and edges representing co-occurrences of terms within the data. The color coding indicates the degree or strength of connectivity between the nodes, which often corresponds to how frequently terms are mentioned together. Words like “datum”, “government”, “volunteer”, “disaster”, “support”, and “people” appear to be central nodes with many connections. This suggests they are key topics within the interviews and common discussion points across various stakeholders. This shows the cooperation between the government and volunteers and the focus on the people in the face of disaster prevention, putting people at the center and supporting a life of well-being.
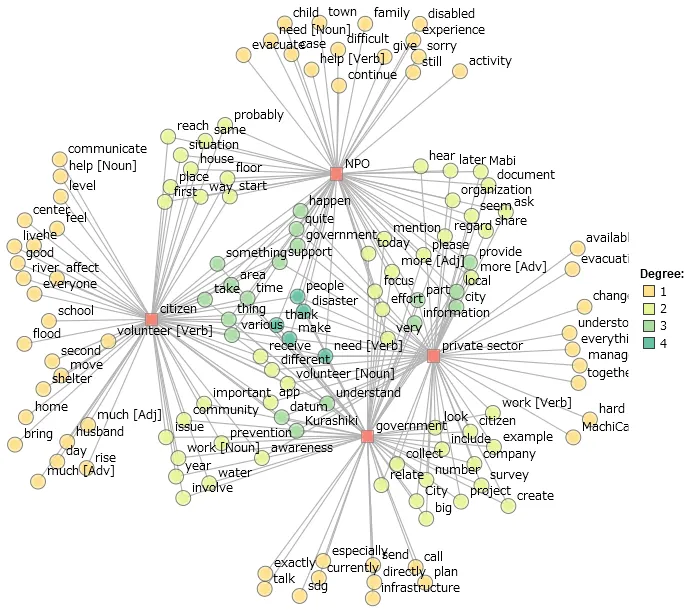
. Words–variable/headings co-occurrence network of Interview Text.
Discussions among stakeholders have different emphases as well as the same emphases. The presence of terms like “volunteer”, “community”, “support”, and “help” in proximity to “disaster” connected with NPO and citizens suggests a strong community response theme. Similarly, the grouping of “datum”, “Kurashiki”, and “government” “company” connected with government and private sector suggests discussions about data management and policy-making at a municipal level.
- 2.
-
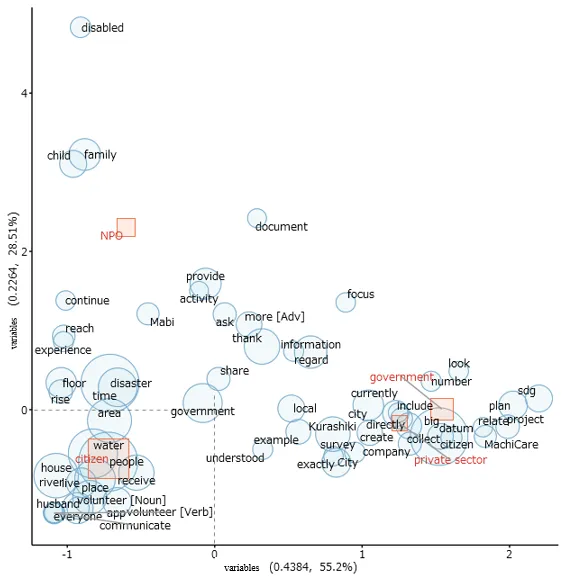
Correspondence analysis: In this multidimensional scaling plot, terms from the dataset are plotted in a two-dimensional space to illustrate their relationships based on their co-occurrence in the data. As shown in , the area of each circle is proportional to the frequency of the word, while the area of each square is proportional to the volume of text from that stakeholder group. Words and variables positioned further from the origin (0,0) have stronger characteristics. The plot reveals a notable proximity between the stakeholders “government” and “private sector” and key terms such as “datum”, “project”, and “SDG” in the right quadrant. This spatial arrangement strongly suggests that discussions around public-private partnerships for data-driven SDG projects were a central theme in the interviews. Here’s a general interpretation of such a plot ():
. Correspondence analysis of words and variables.
shows the results of correspondence analysis. The values of the “stakeholder” variable, such as “government”, and words, are plotted with squares and circles, respectively. Using correspondence analysis, we can explore the correspondence between the variable and words by plotting them on the same diagram. The area of each circle is proportional to the number of occurrences of each word. Therefore, the more frequently the word appears, the larger the circle becomes. The area of each square is proportional to the number of words in the text of that value.
In correspondence analysis, uncharacteristic words uniformly found in all parts are plotted near the origin (0, 0) (
i.e., the point at which the ordinate and abscissa are both zero), whereas words having strong characteristics are located away from the origin. The horizontal (
x-axis) and vertical (
y-axis) lines represent the dimensions that explain the most variance in the data. The origin (where the axes intersect) is the average profile of the data. Terms that are closer together are more likely to co-occur in the dataset. For example, “big” “data” “citizen”, “SDG” “plan” and “project” being close to each other suggests these terms are often mentioned in the same context, which indicates conversations about large-scale projects, SDGs initiatives, and the involvement of the private sector and data-centric programs like MachiCare. The plot is divided into four quadrants, each representing different thematic groupings. There is a pairing between “government” and “private sector” as well as related terms like “datum”, “collect”, and “project”, which could indicate a discussion around public-private partnerships or joint initiatives.
Step 2: In this period, we set coding categories with associated keywords for qualitative analysis of interview data. In the second step, a detailed qualitative analysis was conducted based on a systematic coding process. The five coding categories detailed below were not established arbitrarily. Instead, they were systematically derived from the primary themes and concepts identified through the initial quantitative text analysis of both government documents and interview transcripts, as described in Step 1. This data-driven approach ensures the coding rules are grounded in the content of the text itself. To ensure consistency in the application of these rules, all coding was performed by a single researcher. These categories and keywords would be used to manually code interview responses to organize and analyze them according to relevant themes. By these codes of interview data, we would go through the transcripts and assign these codes to segments of text where the keywords or their synonyms appear. By doing Cross-Tabulation Analysis. It can be analyzed that the frequency of codes, the context in which they appear, and the relationships between different codes.
Five codes are listed below. According to the analysis in step1of the government document and interview text, we decided the 5 codes in
Box 1.
.
5 codes decided.
∗datum
app or datum or information or big or machicare
∗sdg
sdg or live or work or activity or plan or project or business or document
∗disaster prevention
sdg or prevention or disaster or water or business or flood or infrastructure or shelter or evacuate or evacuation
∗city
city or kurashiki or town or community or Mabi or City or local
∗people
citizen or child or husband or family or home or house or awareness or everyone
Datum: This category captures any mention related to applications (apps, machicare), data (datum), or information. When interviewees talk about using an app, data processing, or information dissemination, these segments are coded under the datum category.
SDG: This category is related to the Sustainable Development Goals and includes general terms associated with living conditions, work, activities, plans, projects, business initiatives, or documents. When interviewees discuss anything related to their life or work that pertains to SDG initiatives or business projects, they are coded under the SDG category.
Disaster Prevention: This category is about disaster preparedness and response. It includes terms related to SDGs, prevention, disasters, water management, floods, infrastructure, shelters, and evacuation procedures. Any part of an interview discussing how to prevent disasters, responses to flooding, or infrastructure meant for such events would be coded here.
City: This category focuses on urban or community-related discussions. It includes mentions of cities in general, specifically Kurashiki, towns, communities, the Mabi area, and local issues. Interview segments referencing community experiences or local initiatives are coded under the city category.
People: This category is oriented towards individuals and family units. It encompasses mentions of citizens, children, spouses, families, homes, houses, awareness, and inclusivity (everyone). Interview responses that talk about personal experiences, family matters, or public awareness are coded here.
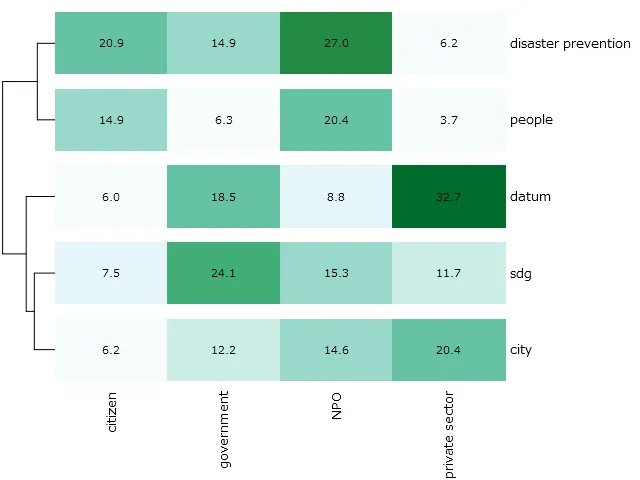
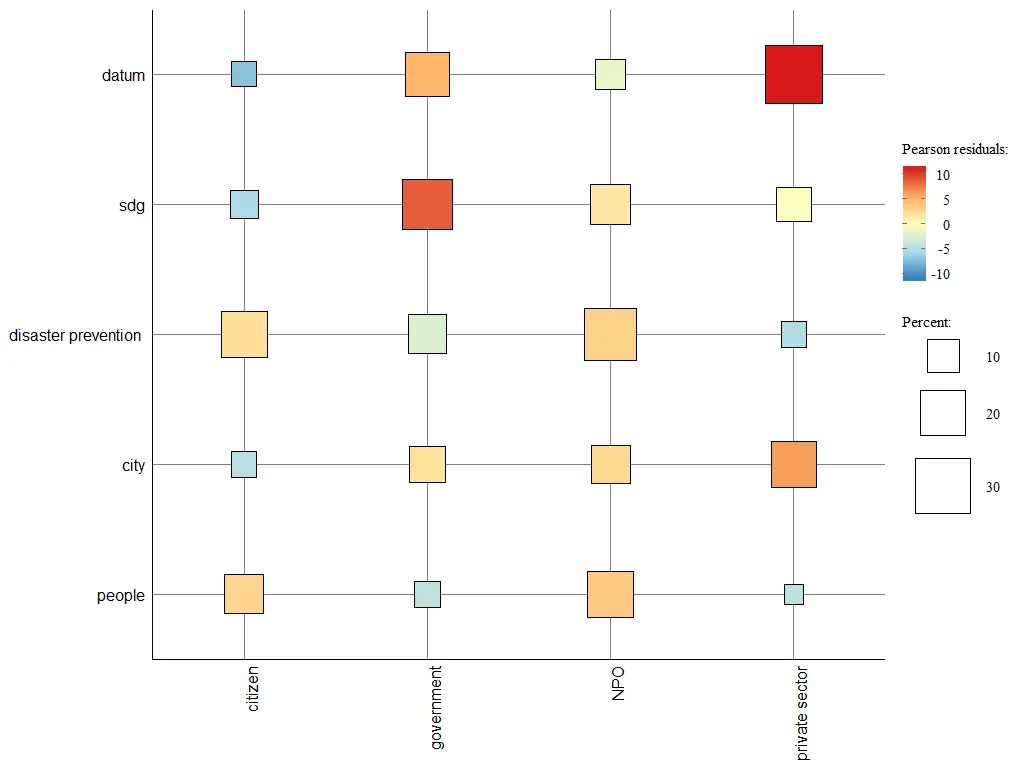
Cross-Tabulation Analysis: Cross-tabs are a basic tool of quantitative data analysis used in various fields, which display the frequency distribution of variables to analyze the relationship between them. In this analysis, it is allowed to display the tabulation results as a heat map or bubble plot (shown respectively), or a line chart.
On a heat map, frequency is indicated using a gradient color scale; hence, wherever a code appears frequently, it has a darker color. This type of information can also be shown with hierarchical cluster analysis that applies the Ward method and uses the Euclidian distance for clustering, as shown in . One important feature of heat maps is that they provide an overview of the entire text file on a single screen [
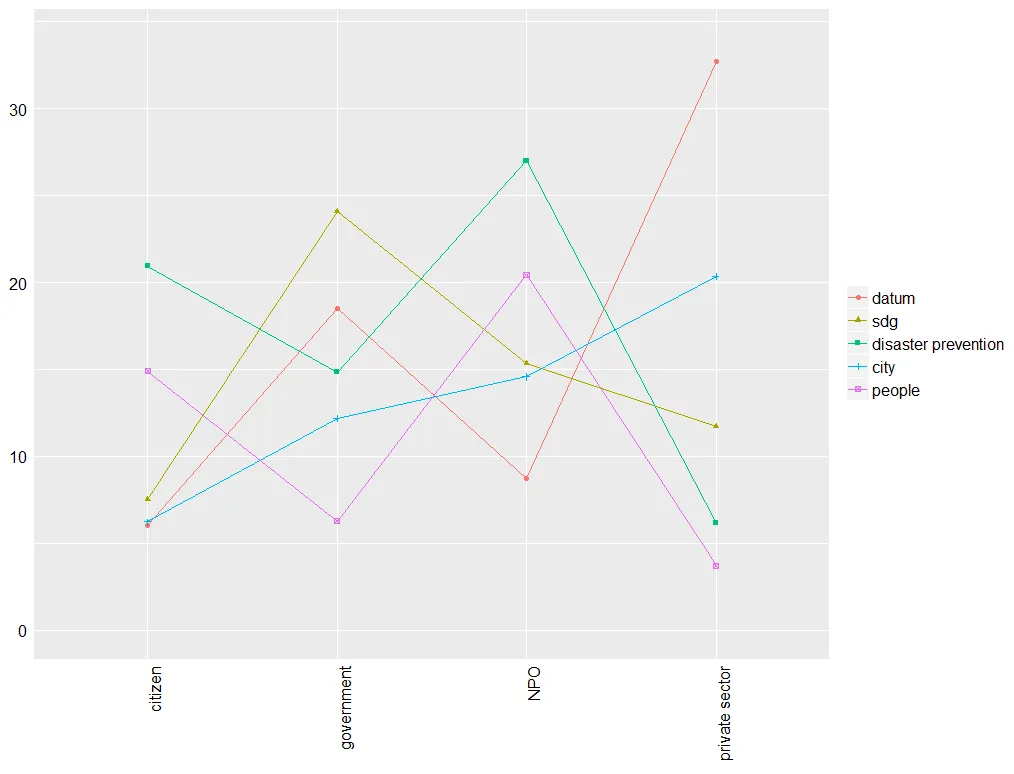
17]. It can observed that association is close to what would be expected under independence, while larger absolute values (darker colors) indicate a stronger association or dissociation than expected. For example, the private sector has the strongest relation with the datum category, and the government has the strongest relation with SDGs, indicating each stakeholder’s role. The plot identifies which SDGs and aspects of disaster prevention are most strongly associated with citizens, government entities, or NPOs ().
. Heat map of Cross-Tabulation.
. Bubble map of Cross-Tabulation.
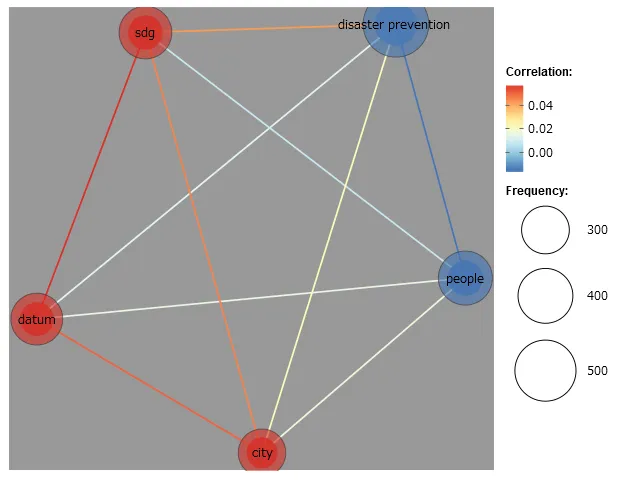
The interconnection between these 5 categories is displayed in the co-occurrence network (), which shows the strong relation between SDG and datum and city, which is colored red with high correlation, and SDG and disaster prevention are related by a relatively red line, showing the inner connection between them, and people connection with datum, and SDG, which show the people centric policy making.
. Co-occurrence network of codes.
In , the term “datum” has a high frequency in relation to the “government” and “private sector”, which indicates that the public-private partnership between them to utilize big data for SDGs policy making and grassroots application. “SDG” shows variability across categories, suggesting that Sustainable Development Goals are a topic of conversation across various stakeholders. Relatively low in the citizen aspect shows that the popularity of SDGs among citizens is not well, and citizens’ awareness of SDGs could be one of the directions of government activity. “Disaster prevention” has a peak at NPO stakeholders, indicating that this NPO is particularly involved in disaster prevention discussions. “People” as a variable appears to be most frequently mentioned or relevant in the context of “citizen” and “NPO”, indicating discussions about civic engagement and the role of non-profits in people-centric initiatives.
. Line chart of Cross-Tabulation.
4. Discussion
Through the literature review, Big Data has been most widely used in three areas in the SDGs push: government policy, education, and citizen science. However, to fully utilize its potential, a concerted effort must be made to establish robust data governance structures, improve data literacy, and promote inclusive participation across all social sectors. Realizing this vision, however, will require increased efforts in several key areas. Synthesizing the results from the quantitative analysis of government documents and the qualitative analysis of stakeholder interviews provides a clearer understanding of the current situation in Kurashiki City. This integrated analysis reveals, first and foremost, a gap between policy objectives and citizen awareness. The frequency analysis of government documents showed that SDG-related terms appeared 157 times, indicating that SDGs are a central theme of the city’s policy. However, the cross-tabulation analysis of the interviews revealed that discussions about SDGs were concentrated among government and private sector stakeholders, with a comparatively low frequency among citizens. This finding highlights the challenge that top-down policy goals have not yet fully translated into widespread public awareness and engagement. Secondly, the integrated analysis clarifies the potential and current challenges of data utilization. The interviews showed a strong interest in data utilization, particularly within the private sector, suggesting significant potential for data-driven approaches through public-private partnerships. On the other hand, the hierarchy cluster analysis of the policy documents indicated that the terms’ datum’ and ‘SDG’ were not closely linked, suggesting that data utilization has not yet been fully integrated as a core strategy for achieving SDGs at the policy level. By combining these insights, we can conclude that leveraging the dynamism of the private sector to more explicitly incorporate data-driven strategies into the city’s core SDG framework is a crucial future direction.
First, improving data infrastructure and data accessibility is fundamental and requires clearer strategies and action plans. Second, deepening investment in research and education is critical to developing talent capable of meeting the challenges of the SDGs, especially in the use of big data technologies. Furthermore, while public-private partnerships (PPPs) are recognized as an effective way to promote the SDGs, there is still a lack of concrete operational guidelines on establishing and maintaining these partnerships [
5]. Therefore, this study selects Kurashiki City, Japan, as a case study to delve into the use of open data and the interactions between different stakeholders, and conducts qualitative and quantitative analyses, which show that the various stakeholders are interconnected and communicate with each other, thus constructing a systematic framework. The framework is intended to serve as a reference for other medium-sized cities regarding data-driven sustainable development. By analyzing the experience of Kurashiki City, we aim to reveal practical paths for using big data to advance the SDGs and how to achieve better a harmonious combination of technological and social goals in urban management and community engagement. This includes establishing dialog and cooperation among different stakeholders and overcoming challenges encountered in the application of technology.
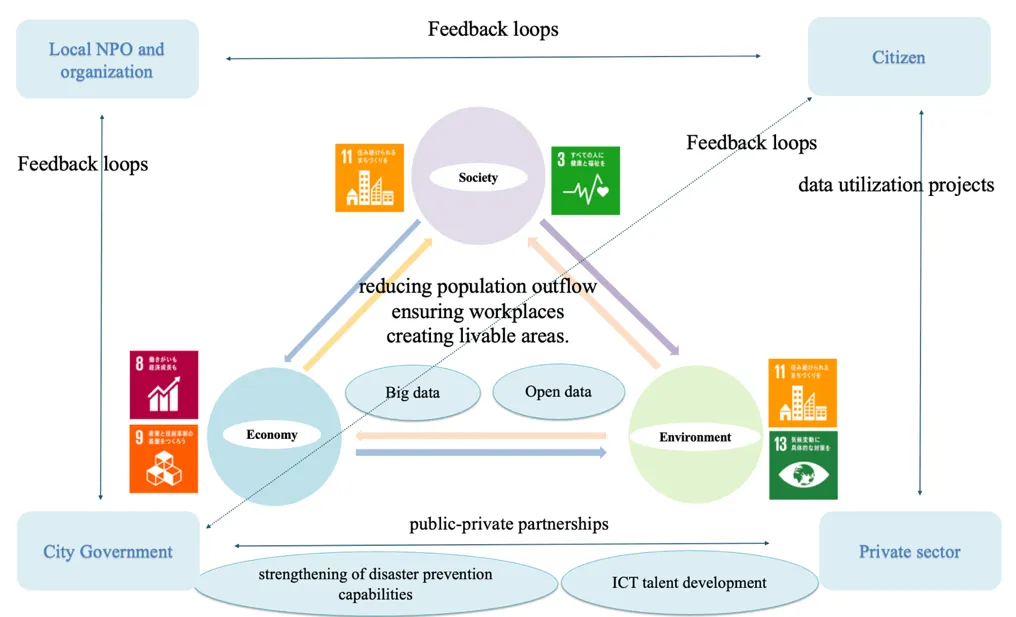
The framework aims to utilize this big and open data and the valuable citizen feedback obtained through the survey to set clear and measurable goals and develop KPIs. The development of a big data policy within this framework contributes to developing the SDGs.
Public-Private Partnerships: A cornerstone of the framework is the promotion of strong public-private partnerships. Based on the integrated analysis of policy documents and stakeholder insights, this study proposes the policy implementation framework shown in . This framework is structured around the three pillars of sustainable development—Economy, Society, and Environment—and is fueled by the utilization of big data and open data. Key components include public-private partnerships to drive initiatives such as ICT talent development and disaster prevention, and feedback loops from citizens, channeled through local NPOs and surveys, to ensure a people-centric approach. These alliances are the driving force behind a variety of initiatives, including projects to leverage data, develop ICT expertise, and strengthen disaster prevention mechanisms. These partnerships also facilitate the creation of digital tools, such as websites and mobile applications, that not only engage local citizens but also benefit neighboring cities [
17].
. Policy implementation framework.
Feedback loops for citizen-centered development: Feedback loops established through local non-profit organizations and systematic citizen surveys are part of the framework, and these feedback mechanisms play a key role in ensuring that actions taken, whether it is the introduction of a new policy or the launching of a community program, are in line with the needs of the population. Through this process, Kurashiki City ensures that its approach to advancing the SDGs is not only strategic, but also emphasizes a citizen-centered approach.
While the proposed framework aligns with the general principles of SDG localization advocated by international bodies like the OECD and UN-Habitat, which emphasize multi-level governance and stakeholder engagement, it offers several unique contributions. Unlike these broader, often process-oriented models, our framework is specifically tailored to the context of a medium-sized city and places big data and open data at the core operational nexus linking the economic, social, and environmental pillars. Furthermore, it moves beyond general calls for public-private partnerships by specifying their role in achieving concrete local objectives, such as ICT talent development and disaster prevention, as identified through our case study. Finally, it explicitly models the crucial role of citizen feedback loops, channeled through local NPOs. It provides a more granular and action-oriented mechanism for ensuring a people-centric approach than is typically found in higher-level international frameworks.
5. Conclusions
Through the literature review, Big Data has been most widely used in three areas in the SDGs push: in government policy, education and citizen science. However, to fully utilize its potential, a concerted effort must be made to establish robust data governance structures, improve data literacy, and promote inclusive participation across all social sectors. Realizing this vision will require increased efforts in several key areas. First, improving data infrastructure and data accessibility is fundamental. Second, deepening investment in research and education is critical to developing talent capable of meeting the challenges of the SDGs, especially in the use of big data technologies. In addition, public-private partnerships (PPPs) are recognized as an effective way to promote the SDGs. Therefore, this study selects Kurashiki City, Japan, as a case study to delve into the use of open data and the interactions between different stakeholders and conducts qualitative and quantitative analyses to derive the benefits and challenges of big data applications from the perspectives of the various stakeholders. It can be seen that the various stakeholders are interconnected and communicate with each other, thus constructing a systematic framework. The framework is intended to serve as a reference for other medium-sized cities in terms of data-driven sustainable development. By analyzing the experience of Kurashiki City, we aim to reveal practical paths for using big data to advance the SDGs and how to achieve better a harmonious combination of technological and societal goals in urban management and community engagement. This includes how to establish dialog and cooperation among different stakeholders, as well as recommendations to address challenges encountered in the application.
Finally, it is important to acknowledge the limitations of this study. The findings are derived from a qualitative, key informant approach with a sample size 24. While this method provides deep contextual insights, the results are not intended to be statistically generalizable to the entire population of Kurashiki. Additionally, while the use of a single coder for the qualitative analysis ensured consistency, it also means that inter-coder reliability could not be calculated. Future studies could build upon this research by employing a larger sample or involving multiple coders to further validate the findings.
Author Contributions
Conceptualization, Y.C. and R.S.; Methodology, Y.C.; Software, Y.C.; Validation, Y.C.; Formal Analysis, Y.C.; Investigation, Y.C., A.T.; Resources, Y.C., R.S. and S.K.; Data Curation, Y.C.; Writing—Original Draft Preparation, Y.C.; Writing—Review & Editing, O.Y.; Visualization, Y.C.; Supervision, R.S.; Project Administration, Y.C.
Ethics Statement
Not applicable.
Informed Consent Statement
Informed consent was obtained from all subjects involved in the study.
Data Availability Statement
The data used in this study were obtained through personal interviews with participants. Due to the confidential and identifiable nature of the interview content, the data are not publicly available in order to protect participant privacy.
Funding
This research was funded by the CBAS project titled: “Effectiveness of “Big data” analysis for small and medium sized cities in Japan to achieve their SDGs.
Declaration of Competing Interest
The authors declare that they have no known competing financial interests or personal relationships that could have appeared to influence the work reported in this paper.
References
-
1.
United Nations. Transforming Our World: The 2030 Agenda for Sustainable Development; United Nations: New York, NY, USA, 2017.
-
2.
United Nations. Peace, Dignity and Equality on a Healthy Planet. 23 December 2023. Available online: https://www.un.org/en/global-issues/big-data-for-sustainable-development (accessed on 16 July 2025).
-
3.
DESA, United Nations Department of Economic and Social Affairs. Population Division. In World Urbanization Prospects: The 2014 Revision, Highlights; United Nations: New York, NY, USA, 2014.
-
4.
The World Bank. Open Data for Sustainable Development; The World Bank: Washington, DC, USA, 2015.
-
5.
International Council for Science (ICSU). Review of Targets for the Sustainable Development Goals: The Science Perspective; International Council for Science (ICSU): Paris, France, 2015. Available online: https://council.science/publications/review-of-targets-for-the-sustainable-development-goals-the-science-perspective-2015/ (accessed on 16 July 2025).
-
6.
United Nations Economic and Social Council (UNESC). Report of the Global Working Group on Big Data for Official Statistics; Economic and Social Council: New York, NY, USA, 2015.
-
7.
Japan Science and Technology Agency. Mobilizing Science, Technology and Innovation for SDGs Japanese Actions in STI for SDGs; Japan Science and Technology Agency: Tokyo, Japan, 2021.
-
8.
Ucla Center For Health Policy Research. Key Informant Interviews; UCLA Center for Health Policy Research Health DATA Program: Los Angeles, CA, USA, 2023.
-
9.
Wang Mindong HP. Employment Situation for Taiwan ese Talents of Japanese before and after the COVID-19 Epidemic.
Jpn. Acad. J. 2023,
26, 17–39.
[Google Scholar]
-
10.
Stephens-Davidowitz S. Everybody Lies: Big Data, New Data, and What the Internet Can Tell Us about Who We Really Are; Bloomsbury Publishing Plc.: London, UK, 2018.
-
11.
Mayer-Schnberger V. Big Data: A Revolution That Will Transform How We Live, Work and Think; Mayer-Schnberger V, Cukier K, Eds.; John Murray Publishers: London, UK, 2013.
-
12.
Gantz J, Reinsel D. Extracting Value from Chaos. IDC iView. 2011. pp. 1–12. Available online: https://www.slideshare.net/slideshow/idc-report-extractingvaluefromchaos/15868083 (accessed on 16 July 2025).
-
13.
Ibrar Yaqoob IA. Big data: From beginning to future.
Int. J. Inf. Manag. 2016,
36, 1231–1247.
[Google Scholar]
-
14.
Chen CP, Zhang CY. Data-intensive applications, challenges, techniques and technologies: A survey on Big Data.
Inf. Sci. 2014,
275, 314–347.
[Google Scholar]
-
15.
Martin Hilbert PL. How to Measure the World’s Technological Capacity to Communicate, Store, and Compute Information Part I: Results and Scope.
Int. J. Commun. 2012,
6, 956–979.
[Google Scholar]
-
16.
Ministry of Internal Affairs and Communications (MIC). The White Paper on Information and Communications in Japan; Ministry of Internal Affairs and Communications (MIC): Tokyo, Japan, 2017.
-
17.
HIGUCHI K. KH Coder 3 Reference Manual; Ritsumeikan University: Kyoto, Japan, 2016.