1. Introduction
Fertility patterns are closely intertwined with socioeconomic development, female educational and occupational upliftment, and access to reproductive healthcare facilities [
1,
2,
3,
4]. Studies found declining fertility is frequently associated with increased literacy, delayed marriage, and enhanced family planning efforts [
2,
3]. There are several other aspirational factors, focus on desired family size, as well as values related to child and family, that significantly decline the fertility [
4]. Studies in the Philippines and Zambia showed perceptions of couples, especially females, were important for fulfilling desired family planning objectives, and knowledge about fertility and family planning measures are indispensable for reducingthe birth rate [
5,
6]. India’s fertility transition has unfolded over the past three decades, with significant progress achieved across most regions during the last ten years [
4,
7,
8]. Southern and many western states of India have reached replacement-level fertility, while northern, Hindi-speaking states continue to report higher fertility rates. Scholars attribute the regional disparities in fertility decline to various factors, including female education, effective family welfare programs, widespread media exposure, and socio-political movements such as backwards-class mobilisation[
1,
4]. Research also shows that in low-fertility states, women increasingly follow a structured life course—marriage followed by early childbirth and timely adoption of sterilisationto limit higher-order births [
4]. Conversely, fertility remains relatively high in northern states, where patriarchal norms, agrarian economies, and low female educational attainment persist [
4,
9].
West Bengal, positioned between these two demographic extremes, has experienced a significant fertility decline in recent decades [
1,
4,
10]. Historical evidence indicates that the birth rate (BR) in undivided Bengal experienced a sharp decline between the 1940s and 1944s, likely due to severe economic distress during that period [
4,
7]. Despite a slight increase in the age at marriage, recent analyses employing period parity progression ratios suggest that the age at first birth among women in West Bengal has remained largely unchanged. Nonetheless, a marked fertility decline—particularly evident during the 1990s—has occurred. This decline appears to be driven not by delayed initiation of childbearing but by a growing tendency among women to limit their family size to two children, increasingly avoiding higher-order births [
4,
10]. However, this transition has not been uniform across the states and districts of the states. Howrah district, a rapidly urbanisingarea with industrial urban zones and agrarian rural belts, provides a unique context for studying fertility trends. Situated next to Kolkata—one of the earliest Indian megacities to reach an exceptionally low fertility rate—Howrah district has been significantly shaped by the city’s aspirations and prevailing behavioural trends [
4]. Existing evidence suggests that age at marriage, early childbearing, and short birth intervals remain prevalent in several parts of the district [
11]. At the same time, increased exposure to education and family planning services has contributed to a gradual reduction in the average number of children per woman. Earlier studies indicate that early years of marriage are particularly crucial for fertility regulation, as a majority of births occur within the first decade of marital life [
12,
13]. Additionally, perceptions of ideal family size, contraceptive use, and gender norms play a vital role in shaping fertility behaviour across generations [
8,
9].
Understanding fertility behaviour in the Howrah district necessitates an analysis of generational shifts, household dynamics, and the socio-cultural context shaping reproductive choices. Adopting a generational perspective and grounded in ethnographic data, the study aimed to trace shifts in fertility behavior across generations and identify key socio-demographic factors influencing fertility decisions and transitions within a rapidly evolving socio-economic landscape.
2. Materials and Methods
2.1. Study Participants
This community-based cross-sectional ethnographic study was conducted between October and November 2024, using random sampling among ever-married women in both urban and rural areas of Howrah district, West Bengal, India. A total of 695 women were approached for the study, of whom 665 agreed to answer all questions and were included in the final analysis.
Out of the 23 districts in West Bengal, Howrah was randomly selected for this study. Data were collected from various wards of the Howrah Municipal Corporation to represent the urban population, and from the community development blocks of Uluberia to represent the rural population. Only the female participant was selected from each household. Data were collected using a pre-designed and pre-tested household schedule through face-to-face interviews. Anthropologically trained ethnographers conducted house-to-house visits to interview eligible women. In-depth interviews (IDIs) were conducted with six participants—two from each generation—to explore issues related to fertility behaviour and the influence of social and economic changes on fertility patterns. Three focus group discussions (FGDs) within each generational cohort were also conductedto explore generational perspectives on fertility behaviour further.
Data entry was performed using Microsoft Excel, and the dataset was later imported into STATA-14 for final analysis.
2.2. Variables
The study examined variables influencing fertility behaviour, as presented in . These included individual and household-level control variables, factors that constrain childbearing and childrearing, and variables reflecting family and individual values. International research has widely tested and accepted these variables [
4].
The primary outcome variable in this study, a count variable, was based on responses to the question about the total number of children. The explanatory variables were organisedinto three main categories: individual and household-level control variables, factors constraining childbearing and childrearing, and variables reflecting family and individual values (see ).
.
Variables tested for significance of association in multivariate binary logit regression models.
| Individual and household-level control variables: number of own siblings/number of siblings of the husbands (continuous); sex of the child (categorised as boy and girl)/total number of children; type of family (categorised as nuclear and joint); religious belief (categorised as Hindu and Muslim); economic status has been categorisedas per capita monthly expenditure (categorised as bottom quintile, middle quintile and upper quintile), marital duration (continuous), Household crowding (<2.0 and ≥2.0), Place of residence(Urban and Rural) |
| Variables indicating constraints for childbearing and childrearing: years of schooling for males and females (categorisedas Primary, Secondary and Higher); degree of media exposure (categorised as Exposed and Non-exposed); work-status/type of work (categorised as Blue collar, White collar and Not-employed for women; and Blue-collar and White collar jobs for men); and importance of leisure time for own (categorised as not important/rather important and very important) |
| Variables specifying family and individual values: marriage is an outdated institution (categorised as fully/partially agree and do not agree at all); child is essential for life-fulfilment (categorised as fully agree and partially agree/do not agree at all); parents should sacrifice for their children (categorised as fully agree and partially agree/do not agree at all); wealth flows from parent to child now a days (categorised as fully agree and partially agree/do not agree at all); whether depend on children during old age (categorised as fully/partially agree and no agree at all) |
2.3. Estimation of Generation Length
The estimation of generation length was carried out using the method originally proposed by Glass et al. (1952) [
14], and later adopted by Srinivasan and Mukherjee (1976) and Mukherjee et al. (2007) [
15,
16]. The average age at first childbirth was calculated separately for men and women. Weighted means were used to determine the average age for both sexes, resulting in an identified generational span of 27 years. Based on this, three generational cohorts were defined for the study: Generation I (56 years and above), Generation II (28 years to 55 years), and Generation III (27 years and below).
To avoid the recall problem during the collection of data on age, age at marriage, age at first childbirth of the participants, especially those who were elderly, some reference points (historical, political and natural disaster) spread across the country were used. Participants undergoing neurological or psychological distress treatment were excluded to minimisepotential biases and ensure greater accuracy in recall-based responses.
2.4. Statistical Analysis
The primary outcome variable in this study is the ‘number of children,’ which constitutes non-negative count data. Accordingly, a Poisson regression model was initially considered. However, given the data’s dispersion characteristics, a negative binomial regression analysis was ultimately employed across four successive models, as presented in .
.
Negative binomial regression models analysing fertility behaviour.
| Negative Binomial Regression Models |
Outcome Variable |
Explanatory Variables |
| Model I |
Number of children (count variable) |
Generation (Generation I, Generation II, Generation III) |
| Model II |
Number of children (count variable) |
Model I + Variables indicating constraints for childbearing and childrearing |
| Model III |
Number of children (count variable) |
Model II + Individual and household-level control variables |
| Model IV |
Number of children (count variable) |
Model III + Variables specifying family and individual values |
3. Results
presents the key socio-demographic and economic characteristics of the surveyed participants (N = 665). Participants were stratified into three generational cohorts: Generation I (aged 56 years and above) comprised 19.10% of the sample; Generation II (aged 28–55 years) represented the majority at 65.26%; and Generation III (aged 27 years and below) accounted for 15.64%. The mean age at marriage among participatory women was 22.25 years (±4.4). Around 47.0% of the women had completed secondary education. By contrast, educational levels among their husbands were notably lower; around 69.77% had received only a primary education.Around 64.96% of the women were not engaged in paid employment at the time of the survey, while 20.00% held blue-collar jobs and 15.04 per cent were employed in white-collar occupations. In comparison, a majority of their husbands (77.44 per cent) were employed in white-collar professions.A predominant 91.28% of the participants identified as Hindu, while 8.72% were Muslim. Caste-wise distribution revealed that 56.99% of the participants belonged to the General category, followed by 24.36% from Scheduled Castes (SC), 11.58% from Other Backwards Classes (OBC), and 7.07% from Scheduled Tribes (ST).The median number of siblings reported by participants was 3.0, while that of their husbands was 2.9. The average number of children per woman in the current sample stood at 1.64. Furthermore, the median monthly per capita monthly household expenditure was estimated at INR 4687 (approximately USD 55.12).
.
Sample characteristics of the study population.
| Background Characteristics |
N = 665 |
| % of participants belonged to Gen-I |
127(19.10) |
| % of participants belonged to Gen-II |
434(65.26) |
| % of participants belonged to Gen-III |
104(15.64) |
| Mean age at marriage for women |
22.25 ± 4.4 |
| Educational attainment of the participant |
|
| Primary |
144(21.65) |
| Secondary |
312(46.92) |
| Higher |
209(31.43) |
| Educational attainment of the participants’ husbands |
|
| Primary |
464(69.77) |
| Secondary |
81(12.18) |
| Higher |
120(18.05) |
| Occupational attainment of the participant |
|
| Blue Collar |
133(20.00) |
| White Collar |
100(15.04) |
| Not Employed |
432(64.96) |
| Occupational attainment of the participants’ husbands |
|
| Blue Collar |
150(22.56) |
| White Collar |
515(77.44) |
| Religion belief |
|
| % of participants believer in Hinduism |
607(91.28) |
| % of participants believer of Islam |
58(8.72) |
| Caste |
|
| % of participants belonged to General |
379(56.99) |
| % of participants belonged to OBC |
77(11.58) |
| % of participants belonged to SC |
162(24.36) |
| % of participants belonged to ST |
47(7.07) |
| Median number of siblings of participants |
3.0 |
| Median number of siblings of the husbands |
2.9 |
| Mean number of children per woman (participant) |
1.64 |
| Percapita monthly household expenditure (median) |
4687.0INR(USD 55.12) |
further disaggregates the sample by number of living children. A sizeable proportion of women (42.41 per cent) had one living child, followed by 38.95 per cent with two children. About 12.33 per cent had three or more children, while a small segment of participants (6.32 per cent) did not have any children at the time of the survey.
.
Percentage of participants by number of living children.
| Number of Living Children |
Number (N = 665) |
| 0 |
42(6.32) |
| 1 |
282(42.41) |
| 2 |
259(38.95) |
| 3 and more |
82(12.33) |
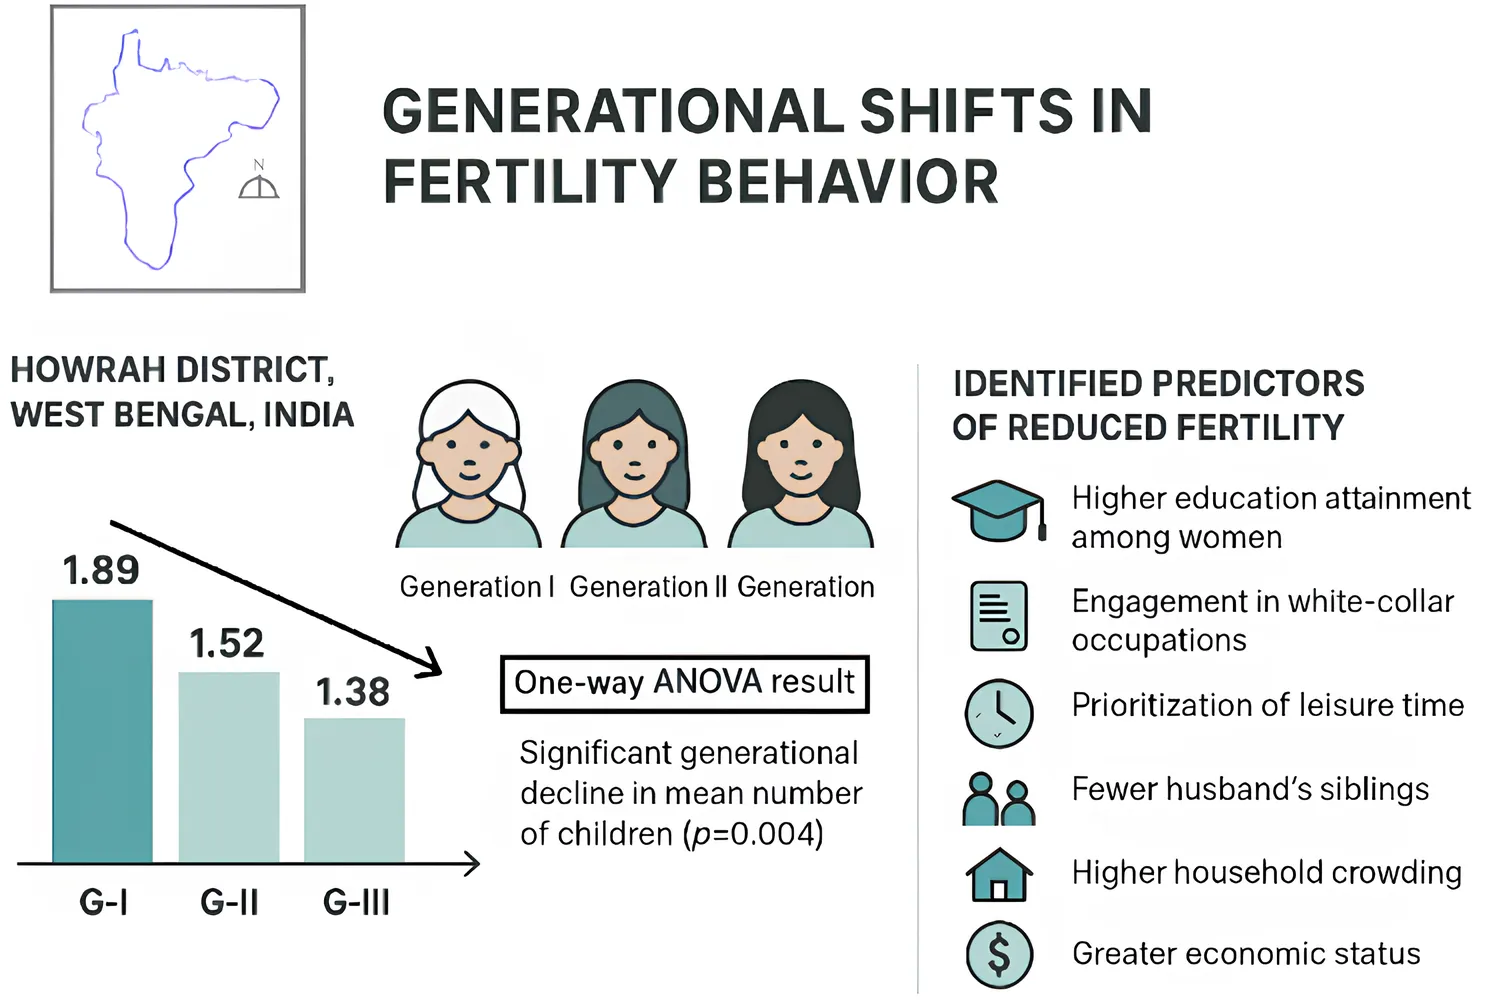
illustrates a one way ANOVA test results of generational difference in the mean number of children among the study participants. Participants of early generation,
i.e., Generation I, exhibited the highest mean number of children (1.89), whereas Generation III, representing the youngest cohort, had the lowest mean (1.38), indicating a statistically significant decline (
p = 0.004) in the mean number of children per woman among the study participants.
.
ANOVA test for generational difference in the mean number of children per woman.
| Generations |
Number of Participants (N) |
MeanNumber of Children |
ANOVA Test |
| Generation I |
127 |
1.89 |
p-Value = 0.004 |
| Generation II |
434 |
1.52 |
| Generation III |
104 |
1.38 |
describes the negative binomial regression analysis identifies generational shift and statistically significant factors influencing the fertility behaviour (number of children) among participants in four successive Models. It was found that generational differences emerge as a strong determinant of fertility behaviour. It was observed that the likelihood of producing more children was significantly less among the participants of Generation II (IRR = 0.81, CI = 0.69, 0.94,
p < 001) and Generation III (IRR = 0.73,CI = 0.59,0.90,
p = 0.001), respectively, compared to the participants of Generation I in Model I. After inclusion of other variables (mentioned in Table1) through Model II to Model IV (described in
), the final, Model IV shows that the participants of Generation II (IRR = 0.99, CI = 0.72, 1.37,
p < 0.01) and Generation III (IRR = 0.95, CI = 0.60, 1.37,
p < 0.01) were significantly less likely to produce more child compared to the participants of Generation I.
The same table also shows that the higher educated participants (IRR = 0.95, CI = 0.72, 1.26,
p < 0.01) and the participants whose husbands were higher educated (IRR = 0.99, CI = 0.85, 1.25,
p < 0.05) were significantly less likely to have more number of children compared to their primary educated counterparts. Participants who were engaged in white collar jobs were significantly (IRR = 0.93, CI = 0.72, 1.22,
p < 0.01) less likely to have more children than those in blue-collar jobs. The importance of leisure time for the participants was found to significantly affect fertility behaviour, including those who found leisure time very important (IRR = 0.51,CI = 0.85, 1.18;
p < 0.05), less likely to have more children than those who found no importance in leisure time.
also shows that participants whose husbands had three or more siblings were significantly (IRR = 0.99, CI = 0.81–1.23;
p < 0.05) less likely to have a higher number of children compared to those whose husbands had no siblings Household crowding found to be significant predictor of fertility behavior showing that household crowding 2 or more (≥2.0) were significantly (IRR = 0.99, CI = 0.85, 1.14;
p < 0.05) less likely to have more number of children compared to those living in household crowding below 2.0 (<2.0). The Muslim participants were significantly (IRR = 1.04, CI = 0.81, 1.35;
p < 0.01) more likely to have more number of children compared to their Hindu counterparts.
showed that the participants who belonged to the upper quintile of per capita monthly household expenditure were significantly (IRR = 0.95, CI = 0.79, 1.15;
p < 0.01) less likely to have more number of children compared to those who belonged to the bottom quintile of per capita household expenditure. It was found that participants with long marriage duration were significantly (IRR = 1.01, CI = 0.99, 1.01;
p < 0.05) more likely to have a higher number of children than those with short marriage duration.
Among variables specifying family and individual values, wives who disagreed that marriage is an outdated institution were significantly (IRR = 0.99, CI = 0.86, 1.16;
p < 0.05) less likely to have more children than those who fully agree with the aforesaid statement. Participants who partially or do not agree with the statement that a child is essential for life were significantly (IRR = 0.95, CI = 0.76, 1.18;
p < 0.05) less likely to have more children than those who agree with the aforementioned statement. Participants who did not agree that wealth flows from parent to child nowadays were significantly (IRR = 1.04, CI = 0.88, 1.23;
p < 0.05) more likely to have a higher number of childrenthan participants who fully agree with the aforesaid statement. Participants who partially or do not agree that old age dependency on children were significantly (IRR = 0.98, CI = 0.84, 1.15;
p < 0.01) less likely to have more childrenthan those who fully agree with the statement of old age dependency on children.
.
Negative binomial regression in the number of children among the participants.
| Background Characteristics |
Model I
IRR(95%CI) |
Model II
IRR(95%CI) |
Model III
IRR(95%CI) |
Model IV
IRR(95%CI) |
| Generation Length |
|
|
|
|
| Gen-I(56 &above)® |
|
|
|
|
| Gen-II(28-55) |
0.81***(0.69, 0.94) |
0.86*(0.73, 1.00) |
0.99**(0.73, 1.35) |
0.99**(0.72, 1.37) |
| Gen-III(Below 27) |
0.73***(0.59, 0.90) |
0.74**(0.58, 0.93) |
0.95(0.62, 1.47) |
0.95**(0.60, 1.49) |
| Variables indicating constraints for childbearing and childrearing |
| Education of the participant |
| Primary® |
|
|
|
|
| Secondary |
|
0.99(0.79, 1.23) |
1.01(0.80, 1.19) |
1.03(0.82, 1.30) |
| Higher |
|
0.73*(0.56, 0.95) |
0.91*(0.75, 1.29) |
0.95**(0.72, 1.26) |
| Education of the participants’ husbands |
| Primary® |
|
|
|
|
| Secondary |
|
1.03(0.75, 1.29) |
1.03*(0.82, 1.32) |
1.03(0.83, 1.28) |
| Higher |
|
1.08(0.91, 1.29) |
1.07(0.80, 1.28) |
0.99*(0.85, 1.25) |
| Occupation of the participant |
| Blue collar® |
|
|
|
|
| White Collar |
|
1.05(0.81, 1.37) |
0.94*(0.72, 1.23) |
0.93**(0.72, 1.22) |
| Not Employed |
|
1.05(0.87, 1.21) |
0.96(0.80, 1.10) |
0.98(0.83, 1.17) |
| Occupation of the participants’ husbands |
| Blue collar® |
|
|
|
|
| White Collar |
|
0.99 (0.85, 1.16) |
1.02(0.84, 1.20) |
1.02(0.87, 1.19) |
|
|
Media exposure |
|
|
| No® |
|
|
|
|
| Yes |
|
1.01(0.80, 1.26) |
1.05(0.82, 1.29) |
1.03(0.81, 1.32) |
| Important of leisure time |
| Not important/rather important® |
|
|
|
|
| Very important |
|
1.02 (0.89, 1.17) |
1.00 (0.88, 1.15) |
0.51*(0.85, 1.18) |
| Individual and household-level control variables |
| Number of siblings of the participant |
| No sibling® |
|
|
|
|
| 1-2 |
|
|
1.01(0.86, 1.29) |
1.04 (0.85, 1.28) |
| 3 or more |
|
|
1.04(0.83, 1.29) |
1.01(0.81, 1.26) |
| Number of siblings of the participants’ husbands |
| No sibling® |
|
|
|
|
| 1-2 |
|
|
1.01(0.80, 1.24) |
1.04(0.84, 1.23) |
| 3 or more |
|
|
0.91*(0.80, 1.25) |
0.99*(0.81, 1.23) |
| Number of sons of the participants |
1.70(1.60, 1.99) |
1.75 (1.59, 1.93) |
| Number of daughters of the participants |
1.71**(1.60, 1.92) |
1.75 (1.59, 1.92) |
| Family type |
| Joint® |
|
|
|
|
| Nuclear |
|
|
1.04(0.88, 1.10) |
1.01(0.87, 1.17) |
| HCI |
| <2.0® |
|
|
|
|
| ≥2.0 |
|
|
0.92*(0.86, 1.12) |
0.99*(0.85, 1.14) |
| Religion |
| Hindu® |
|
|
|
|
| Muslim |
|
|
1.01*(0.86, 1.39) |
1.04**(0.81, 1.35) |
| Caste |
| General® |
|
|
|
|
| OBC |
|
|
0.93 (0.78, 1.20) |
0.94(0.75, 1.18) |
| SC |
|
|
0.91 (0.84, 1.16) |
1.00 (0.85, 1.19) |
| ST |
|
|
0.95 (0.71, 1.15) |
0.98(0.76, 1.25) |
| Per capita monthly household expenditure |
| Bottom quintile® |
|
|
|
|
| Middle quintile |
|
|
0.99 (0.79, 1.24) |
0.98 (0.84, 1.14) |
| Upper quintile |
|
|
0.93**(0.80, 1.20) |
0.95**(0.79, 1.15) |
| Place of delivery |
| Govt. hospital® |
|
|
|
|
| Home |
|
|
0.89*(0.59, 1.12) |
0.85(0.67, 1.07) |
| Nursing home |
|
|
1.06(0.85, 1.32) |
1.04(0.91, 1.19) |
| Place of residence |
| Rural® |
|
|
|
|
| Urban |
|
|
1.00(0.77, 1.20) |
1.00 (0.86, 1.17) |
|
Marital duration |
|
1.06(0.95, 1.09) |
1.01*(0.99, 1.01) |
| Variables specifying family and individual values |
| Marriage is an outdated institution |
| Fully agree® |
|
|
|
|
| Do not agree at all |
|
|
|
0.99*(0.86, 1.16) |
| Child is essential for life |
| Fully agree® |
|
|
|
|
| Partially/do not agree at all |
|
|
|
0.95*(0.76, 1.18) |
| Parents sacrifice for their children |
| Fully agree® |
|
|
|
|
| Partially/do not agree at all |
|
|
|
1.05(0.84, 1.30) |
| Wealth flow from parents to children |
| Fully agree® |
|
|
|
|
| Partially/do not agree at all |
|
|
|
1.04*(0.88, 1.23) |
| Old age dependency on child |
| Fully agree® |
|
|
|
|
| Partially/do not agree at all |
|
|
|
0.98**(0.84, 1.15) |
| Pseudo R2 |
|
|
|
0.33 |
Excerpts from an In-Depth Interview
The in-depth interviews reveal a generational shift in perceptions and beliefs regarding childbearing and childrearing among the participants. Individuals from the earlier generation (Generation I) appeared more rigid in adhering to the traditional belief systems and showed limited autonomy in decision-making. In contrast, participants from the later generations (Generation II and Generation I) showed a willingness to challenge traditional norms and adopt more modern perspectives, suggesting a potential link between changing attitudes and the observed fertility decline in Howrah.
During an open-ended in-depth interview (IDI), a 59-year-old homemaker (Participant of Generation I) with a primary level of education, stated:
I got married at a young age and didn’t really know how to adapt to a whole new family. So, I ended up following the example I’d seen growing up—mostly what I saw my mother do. There was a lot of pressure from both side families,to have children. Nowadays, looking neighbourhood, I feel that having more kid’s feels like a kind of safety net—if one can’t support in older age, maybe another will be able to.
On the other hand, a 25-year-old homemaker (Participant of Generation III) with a higher level of education, stated:
Being a graduate,I aspire to pursue a governmentjob—not just for income but for life-fulfillment. I have convinced my husband and in-laws to delay having children until I am 30years old. They also see that one income isn’t enough for a comfortable life and medical needs.
A 26-year-old, working in a call-centre (Participant of Generation III) with a higher level of education, stated:
Caring for more than one child feels like a heavy burden—what about our own lives? We are human too. I also want some time for myself, and having more children would leave little time for me, and ours.
A participant of Generation I, aged 63 years, a retired school teacher, expresses her concern:
In my time, I managed both school and raising six children, with help from my mother-in-law. Nowadays, relationships with in-laws aren’t as strong, and young women seem less willing to take on childbearing—they’re often preoccupied with mobile phones and personal relationships.
The in-depth interviews reveal that, at times, members of the parental generation quietly support their daughters in pursuing education, delaying marriage, and seeking employment. In some cases, they navigate resistance from their husbands or even confront them directly, all to secure a better future for their daughters.
A participant of Generation II, aged 41 years, a graduate and homemaker, reveals that:
Yes, it’s okay to have children, but we are not machines to keep producing them just because our husbands or parents expect it. We have our own lives, the right to enjoy them, and the right to be heard. I didn’t allow my daughter to marry early and will support her in getting a job—regardless of what my husband or hers might think.
4. Discussion
This community-based study highlights a generational shift in fertility behaviour, analysingthe various factors influencing the number of childbearing among the participating women in Howrah. The findings reveal a marked decline in fertility across generations, with women from the earlier generation exhibiting higher fertility rates, while those from the later generations demonstrate a noticeable reduction. Since the mid-1970s, India has witnessed a remarkable decline in fertility, with the average number of children per woman dropping from approximately six to three within a span of three decades [
17]. Significant fertility reductions have also been observed across many country regions since the early 1980s [
18].
Earlier studies found several proximate determinants of fertility reduction among the population, such as educational attainments, occupational shifts, economic status, and religious beliefs. For example, the present study’s findings that education significantly lowers fertility support the findings of Mohanty et al. (2016)[
19], who argued that increased female literacy is one of the most powerful determinants of fertility decline in Indian districts. Ghosh (2016) similarly documents a decline in childbearing within Kolkata’s lowest-low fertility context, attributing this trend to the influence of education in reshaping women’s aspirations regarding lifestyle and family size [
4]. The study underscores that increased educational attainment enhances reproductive autonomy and broadens life goals, leading urban, professionally employed women—particularly those in white-collar occupations—to postpone or limit childbearing [
4] as observed in the present study. This pattern significantly contributes to the observed decline in fertility in West Bengal, India.Our study also observed that white-collar occupation correlates with reduced fertility,aligning with the earlier study [
4]. In fact, like Ghosh’s participants [
4], our participants did not exhibit widespread voluntary childlessness or rejection of family and marriage, but rather sought a balance between modern ambitions and normative expectations around family life. In patriarchal Indian society, women in early generations were restricted to go outside the home, neither for academic nor for wage-earning purposes.None of their voices were accounted for, while females of younger generations are well aware about their rights and were significantly engaged in higher education as well as wage wage-earning sector,which often helps in shifting fertility behaviour from high to low.
Generational differences in fertility behaviour—specifically, the lower fertility rates observed among younger cohorts—align with the expectations of transition theory in demographic study (DTT). However, as Mohanty et al. (2016) argue [
19], the demographic transition in India has not followed a uniform trajectory. Persistent religious and socioeconomic differentials remain evident; for instance, our study found higher fertility rates among Muslim women, which is consistent with the findings of Jha et al. (2014) and Ghosh (2016)[
1,
4], who reported substantial variations in fertility knowledge, practices, and perceptions across religious groups in West Bengal. A common perception, echoed in the work of Cerroni-Long (1985), suggests that minority communities may adopt higher fertility as a strategy for demographic survival in the context of their relative minority size compared to majority groups [
20].Muslims comprise approximately 14% of the population in India, compared to 80% Hindus [
21]. The minority status, coupled with prevailing narratives about demographic marginalisation, may contribute to higher fertility among Muslims. Additionally, Nasreen et al. (2024) observed that contraceptive use remains relatively low among Muslims, further contributing to elevated fertility rates [
22]. Economic disadvantage is another important factor. Muslims in India experience significantly lower economic conditions compared to other religious groups [
21], which may influence reproductive behaviour. Our study found that higher household expenditure—a proxy for economic affluence—was associated with lower fertility. This finding aligns with Mohanty et al. (2016), who reported that poverty had only a marginal and statistically insignificant effect on fertility reduction [
19]. These results suggest that material affluence alone does not fully explain fertility behavior; rather, fertility decline appears to be more closely linked to evolving aspirations, value systems, and structural determinants such as education and wealth.
Interestingly, the significance of utilisationof leisure time as a predictor of lower fertility in our study aligns with Ghosh’s (2016) interpretation that urban families often adopt low fertility as a strategy to preserve lifestyle choices [
4]. This reflects a shift in aspirations rather than a complete departure from traditional familial norms. Such patterns indicate a nuanced form of the second demographic transition, wherein individualistic preferences increasingly influence, but do not entirely replace, conventional social structures. With the spread of urbanisationand widespread access to the internet, media, and various entertainment options across both rural and urban settings, women are more inclined to prioritisepersonal enjoyment and leisure, often at the expense of time traditionally allocated to childbearing and rearing. Furthermore, the rising involvement of Indian women in wage-earning employment [
23] has been associated with a reduction in fertility-related behaviours. As noted by Ahn et al. (2021) [
24], the considerable time and physical demands of such work often limit the ability and inclination to engage in childbearing and childrearing.
The influence of family background variables in the present study—such as the husband’s number of siblings and household crowding—echoesAnyara and Hinde (2006) analysis of fertility in Kenya, where fertility was found to be mediated by contextual family and kinship structures, even when broader social changes were underway [
25]. These structures continue to mediate reproductive norms, suggesting that fertility transitions in South Asia are embedded within enduring familial logics. The higher household crowding increases the expenditure in families,which often becomes a barrier to lifestyles, medical needs, and enjoying leisure times.
Since the effect of modernisationaround the world, every sector of the population,whether living in rural or urban areas, whether belonging to Hindu or Islamic religion, the perceptions related to specifying family and individual values is changing. These variables, such as views on child essentialism, old-age dependency, and the importance of marriage, offer a rich anthropological insight into fertility behaviour. Ghosh (2016) found that, in Kolkata, aspirations for children’s success and anxieties about economic costs often lead to limiting family size, even in the absence of complete ideological shifts associated with the demographic transition [
4]. Our findings reflect a similar dynamic, where fertility decisions are shaped less by radical value departures and more by pragmatic negotiations between traditional expectations and modern ambitions. Nowadays, the participants of younger generations are well aware of the educational development, career opportunities and other amenities they need to fulfil their aspirations compared to the earlier generation. The participants of earlier generations adhered more strictly to traditional social values, whereas the participants of the younger generation are more open and adaptive to the changes brought about by a modernisingworld. A generational shift in the traditional belief system may lead in the less number if child among the younger generation compared to their early generation counterpart. The individual beliefs and narratives of the women often echoed the findings of Ghosh’s (2016) in-depth study in Kolkata [
4]. Being geographically adjacent to Kolkata—the first Indian megacity to experience lowest-low fertility—it is likely that women in Howrah have been significantly influenced by Kolkata’s urban aspirations and its prevailing trends toward declining fertility.
Indian patriarchal society plays a significant role in shaping social, economic, and familial structures, where men have traditionally held authority and control over household and reproductive decision-making [
7,
26]. Women have historically been socialisedinto roles focused on domestic work, caregiving, and childbearing, with limited autonomy over personal and reproductive choices [
27]. However, with the advancement of modernisation, increased female education, and growing participation in white-collar employment, women’s roles have gradually evolved across generations, leading to greater agency and involvement in decision-making processes [
23]In this changing socio-economic context, the traditional dominance of men in fertility decisions appears to be declining, contributing to a overall decline in fertility in the region.
5. Conclusions
This community-based study underscores a significant generational shift in fertility behaviour, reflecting broader patterns of demographic transition in India. While earlier generations exhibited higher fertility rates, younger cohorts demonstrate a marked decline, shaped by increased educational attainment, economic aspirations, and participation in wage-earning sectors. Education, occupation—especially among women—emerges as a key determinant, enhancing reproductive autonomy and reshaping life goals. Occupational shifts toward white-collar employment and growing lifestyle aspirations among the younger generation have further contributed to fertility decline in urban and rural settings. However, religious and socioeconomic disparities persist, with higher fertility observed among Muslim women, influenced by economic disadvantage and demographic perceptions. Familial structures, leisure preferences, and individualistic aspirations also shape reproductive choices, indicating a nuanced evolution rather than a complete ideological transformation. These findings suggest that fertility behaviour in contemporary India is increasingly influenced by pragmatic negotiations between traditional norms and modern opportunities, with generational transitions serving as a vital lens for understanding these changes.
Acknowledgments
The authors express their sincere gratitude to the study participants for their involvement and to the fieldworker for ensuring smooth data collection during the fieldwork.
Author Contributions
M.A.K. conceptualized the study and wrote and edited the manuscript. S.P. reviewed and edited the manuscript.
Ethics Statement
This study did not involve any invasive experimental procedures. All research activities adhered to the guidelines outlined in the Declaration of Helsinki.
Informed Consent Statement
Informed consent was obtained from all individuals who participated in the study.
Data Availability Statement
The data used in this study were collected through fieldwork.
Funding
This research did not receive any external funding.
Declaration of Competing Interest
The authors declare that they have no known financial or personal conflicts of interest that could have influenced the work presented in this paper.
References
-
1.
Jha SN, Baur B, Haldar A, Dasgupta U. A study on fertility perception: An experience from West Bengal, India.
Int. J. Prev. Med. 2014,
5, 16–20.
[Google Scholar]
-
2.
Bhat PNM. Contours of Fertility Decline in India: A District-Level Study Based on the 1991 Census. 1996. Available online: https://idl-bnc-idrc.dspacedirect.org/server/api/core/bitstreams/c9274222-04d8-48d9-9ed1-1479503c2977/content (accessed on 10 April 2025).
-
3.
Kulkarni PM. The Demographic Transition in India. 2014. Available online: ddugu.ac.in/ePathshala_Attachments/E_PS446060@9c2d3ec4i.pdf (accessed on 15 April 2025).
-
4.
Ghosh S. Second demographic transition or aspirations in transition: an exploratory analysis of lowest-low fertility in Kolkata, India.
Asian Popul. Stud. 2016,
13, 25–49. doi:10.1080/17441730.2016.1203211.
[Google Scholar]
-
5.
Casterline JB, Perez AE, Biddlecom AE. Factors underlying unmet need for family planning in the Philippines.
Stud. Fam. Plann. 1997,
28, 173–191.
[Google Scholar]
-
6.
Biddlecom AE, Fapohunda BM. Covert contraceptive use: Prevalence, motivations, and consequences.
Stud. Fam. Plann. 1998,
29, 360–372.
[Google Scholar]
-
7.
Dyson T, Moore M. On Kinship Structure, Female Autonomy, and Demographic Behavior in India.
Popul. Dev. Rev. 1983,
9, 35–60. doi:10.2307/1972894.
[Google Scholar]
-
8.
Guilmoto CZ, Rajan SI. Spatial Patterns of Fertility Transition in Indian Districts.
Popul. Dev. Rev. 2001,
27, 713–738.
[Google Scholar]
-
9.
Basu AM, Amin S. Conditioning factors for fertility decline in Bengal: History, language identity and openness to innovations.
Popul. Dev. Rev. 2000,
26, 761–794.
[Google Scholar]
-
10.
Pande RP, Astone NM. Explaining son preference in rural India: the independent role of structural versus individual factors.
Popul. Res. Policy Rev. 2007,
26, 1–29. doi:10.1007/s11113-006-9017-2.
[Google Scholar]
-
11.
Ghosh S. Fertility transition in West Bengal: Revisiting Basu and Amin’s (2000) diffusion hypothesis.
Soc. Chang. 2008,
38, 110–116.
[Google Scholar]
-
12.
International Institute for Population Sciences (IIPS) and Macro International. National Family Health Survey (NFHS-3); Ministry of Health and Family Welfare, Government of India: Mumbai, India, 2007.
-
13.
Registrar General of India (RGI). Sample Registration System Statistical Report.2011.Ministry of Home Affairs, Government of India.Avaiable online: https://censusindia.gov.in/nada/index.php/catalog/34790 (accessed on 14 March 2025).
-
14.
Glass B, Sacks MS, Jahn EF, Hess C. Genetic drift in a religious isolate: An analysis of the causes of variation in blood group and other gene frequencies in a small population.
Am. Nat. 1952,
86, 145–159.
[Google Scholar]
-
15.
Srinivasan S, Mukherjee DP. Inbreeding among some Brahman populations of Tamil Nadu.
Hum. Hered. 1976,
26, 131–136. doi:10.1159/000152794.
[Google Scholar]
-
16.
Mukherjee DP, Das S, Banik SD. Trends of consanguineous marriages in a Sunni Muslim population of West Bengal, India.
Anthropol. Anz. 2007,
65, 253–262.
[Google Scholar]
-
17.
Ram B. Fertility decline and family change in India: A demographic perspective.
J. Comp. Fam. Stud. 2012,
43, 11–40.
[Google Scholar]
-
18.
Drèze J, Murthi M. Fertility, Education, and Development: Evidence from India.
Popul. Dev. Rev. 2001,
27, 33–63. doi:10.1111/j.1728-4457.2001.00033.x.
[Google Scholar]
-
19.
Mohanty S, Fink G, Chauhan RK, Canning D. Distal determinants of fertility decline: Evidence from 640 Indian districts.
Demogr. Res. 2016,
34, 373–406. doi:10.4054/DemRes.2016.34.13.
[Google Scholar]
-
20.
Cerroni-Long EL. Marrying out: Socio-cultural and psychological implications of intermarriage.
J. Comp. Fam. Stud. 1985,
16, 25–46. doi:10.3138/jcfs.16.1.25.
[Google Scholar]
-
21.
PRC. Population Growth and Religious Composition in India. 2021. Available online: https://www.pewresearch.org/religion/2021/09/21/population-growth-and-religious-composition/(accessed on 2 June 2025).
-
22.
Nasreen I, Guthigar M, Veigas I. The Knowledge and Practice of Family Planning Among Muslim Women in Rural Karnataka, India.
Cureus 2024,
16, e58088. doi:10.7759/cureus.58088.
[Google Scholar]
-
23.
Chatterjee C, Ramu S. Gender and its rising role in modern Indian innovation and entrepreneurship.
IIMB Manag. Rev. 2018,
30, 62–72. doi:10.1016/j.iimb.2017.11.006.
[Google Scholar]
-
24.
Ahn J, Lee SH, Park MY, Oh SH, Lee W. The Association Between Long Working Hours and Infertility.
Saf. Health Work. 2021,
12, 517–521. doi:10.1016/j.shaw.2021.07.005.
[Google Scholar]
-
25.
Anyara EL, Hinde A. Fertility Transition in Kenya: A Regional Analysis of the Proximate Determinants(Southampton Statistical Sciences Research Institute Applications & Policy Working Paper A06/03). University of Southampton. 2006. Available online: https://eprints.soton.ac.uk/38110/1/38110-01.pdf (accessed on 30 April 2025).
-
26.
Basu AM. Culture, the Status of Women, and Demographic Behaviour: Illustrated with the Case of India; Clarendon Press: Oxford, UK, 1992.
-
27.
Jeffery P, Jeffery R. Population, Gender and Politics: Demographic Change in Rural North India; Cambridge University Press: Cambridge, UK, 1997.
 Saptamita Pal
2
Saptamita Pal
2