1. Introduction
Chromium is a metal with multiple industrial and technological applications, including metallurgy, electroplating, the textile industry, leather tanning, and wood preservation, among others. As a consequence, Cr is frequently found in wastewater, mainly in the trivalent (Cr(III)) and the hexavalent (Cr(VI)) forms [
1]. The WHO has recommended a guideline value of 50 μg L
−1 for total chromium in drinking water [
2]. Cr(VI) presents the highest environmental threat due to its toxicity, together with its high solubility and mobility: it is a well-known human carcinogen and may cause dramatic effects to human health. In contrast, Cr(III) is considered nontoxic or of very low toxicity (300 times lower than that of Cr(VI)) [
1,
2], and has a lower mobility in water.
Cr(VI) can be removed from wastewater through various treatment methods, including chemical reduction, adsorption, and membrane filtration (e.g., [
3,
4,
5]. Reduction methods include traditional chemical and electrochemical treatments or biological processes with reducing bacteria and fungi [
6]. Heterogeneous photocatalysis under UV and visible light has been proposed as a convenient low-cost and efficient technology for Cr(VI) reduction, and an important number of works have been published employing TiO
2 (anatase, rutile, brookite, P25,
i.e., a mixture of around 80:20 anatase, rutile and minor contents of amorphous phases [
7]), modified TiO
2, and other semiconductors, e.g., ZnO, CdS, ZnS, WO
3,
etc.; several papers and reviews have been published recently in this sense [
1,
4,
5,
8,
9,
10,
11,
12,
13,
14,
15,
16] including reactors for technological applications. Cr(VI) reduction has been proposed as a niche application for heterogeneous photocatalysis [
17].
The photocatalytic process is based on the reactivity of electron-hole pairs (e
CB−/h
VB+) generated in the semiconductor through light absorption in the UV-visible range, even under sunlight (e.g., [
8,
9,
10,
11,
17,
18,
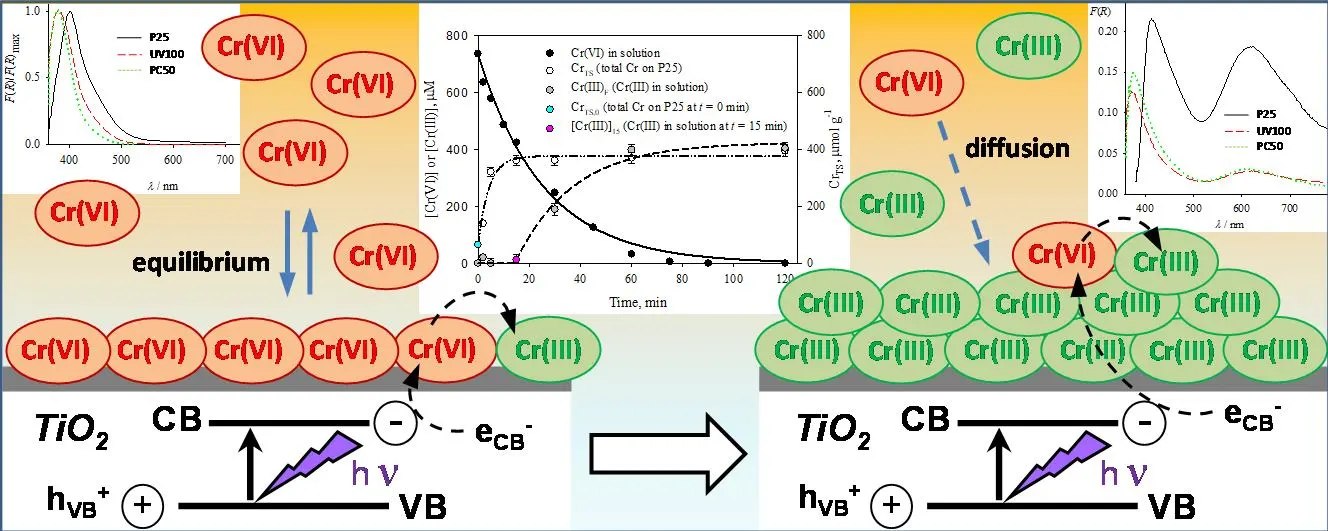
19]). Generally, the mechanism of the photocatalytic Cr(VI) reduction has not been adequately shown, and the process is simply depicted by a direct transfer of three electrons from the CB to Cr(VI) to form Cr(III) in one step. However, since our first papers, our group proposed that the mechanism takes place through three consecutive one-electron transfers, producing Cr(V) and Cr(IV) as intermediates [
8,
9,
10], substantiated by the detection of Cr(V) by EPR [
20,
21,
22]. From a thermodynamic point of view, e
CB− has the appropriate redox potential
vs. SHE (
ECB = –0.3 V for P25) to directly reduce Cr(VI) to Cr(V) (
E0 = 0.55 V), Cr(V) to Cr(IV) (
E0 = 1.34 V) and Cr(IV) to Cr(III) (
E0 = 2.1 V) ([
1] and references therein):
with the global stoichiometry under acidic conditions given by:
In the absence of organic electron donors, surface hydroxyl ions or adsorbed water act as hole scavengers:
but detrimental reoxidation of reduced Cr species by holes or hydroxyl radicals (HO
•) may take place:
This issue has been generally solved by the addition of organic donor compounds (D), which act as hole or HO
• scavengers:
The photocatalytic activity of TiO
2 depends on factors such as its surface area, crystallinity and nature of the surface, presence of doping metals, dosage of photocatalyst, initial concentration of the pollutant, presence of organic electron donors or oxygen, intensity and type of light irradiation, pH value, presence of other molecules that can affect the adsorption of the reactants, presence of interfering ions,
etc. (e.g., [
11]). As photocatalytic reactions occur at the TiO
2 surface, the surface area and the affinities of reactants are considered among the most important factors determining the photocatalytic activity [
23], together with the survival of photogenerated charge-carriers before recombination, factors related to the specific surface area and crystallinity of the photocatalyst, respectively [
24]. Not many papers analyze simultaneously the surface and the solution; as one example, the synergy of photocatalysis and adsorption processes for simultaneous removal of Cr(VI) and Cr(III) with a mixture of P25 and titanate nanotubes was found [
25]. Thus, these two processes must be taken into account to understand the whole system, especially when the reaction products can produce changes in the photocatalyst. One of them is, e.g., the observed TiO
2 inactivation during Cr(VI) reduction, caused by Cr(III) deposition in the absence of complexing donors [
1,
10,
26]. Early studies of Cr(VI) adsorption on anatase indicated that the reaction obeyed the Langmuir absorption isotherm model with the formation of a TiO
2-chromate surface complex [
27,
28]. The occurrence of a strong interaction between Cr(VI) and the surface of the catalysts, in the form of a charge-transfer complex, has been detected later by our group by absorption spectroscopy of transparent nanoparticle colloidal suspensions containing Cr(VI) at pH 1.5, exhibiting an absorption maximum around 375–400 nm [
29,
30]. On P25 and anatase TiO
2, this charge-transfer complex has also been mentioned [
9,
13,
31], with the position of the absorption maximum depending on the nature of the photocatalyst. A mechanism of surface complex formation in condensation-type adsorption, leading initially to Ti–O–CrO
3– followed by Cr(VI) dimerization, has been proposed by García Rodenas et al. [
28] and others [
30,
32]. Therefore, the formation of a charge-transfer complex between Cr(VI) and TiO
2 seems to apply to both solid and suspended TiO
2 nanoparticles.
The produced Cr(III) after the reduction of Cr(VI) can be released in the solution or deposited on the surface as hydrated Cr
2O
3 or Cr(OH)
3, visible as a green deposit on the filtered particles [
1,
26,
28,
33,
34]. Therefore, Cr(III) species could block the surface, preventing the penetration of light and the access of Cr(VI) to the photocatalyst surface, and promoting the detrimental recombination of e
CB− and h
VB+, especially in photocatalysts of high surface area [
11,
14,
26].
Despite the above-mentioned advances on the description of the TiO
2 photocatalytic removal of aqueous Cr(VI), there are many gaps in the mechanistic pathways involved, in particular regarding the photocatalyst deactivation steps and the fate of the reduced Cr(VI) species. In the present work, the behavior of different TiO
2 materials in the processes of adsorption and photocatalytic reduction of Cr(VI) in water at pH 2 is analyzed. In particular, the influence of the type of photocatalyst on the yield, the progressive inactivation of the photocatalyst by Cr(III) deposition, and the effect of adsorbed species are investigated.
2. Experimental
2.1. Materials
Commercial Aeroxide
® TiO
2 P25 (Evonik, Essen, Germany), Hombikat UV100 (Sachtleben Chemie GmbH, Sachtleben, Germany), and Millennium PC50 (Cristal Global Millennium, Thann, France) were used as provided. Rutile was prepared by heating UV100 at 650 °C for 2 h under air [
35]. The presence of the rutile phase in this sample was confirmed by analysis of the X-ray diffraction (XRD) spectrum of the powdered sample, obtained at room temperature with a PW-3710 diffractometer (Philips, Almelo, The Netherlands) using Cu-Kα radiation at a scan rate of 0.02° (2
θ /s), an accelerating voltage of 40 kV and an applied current of 30 mA, and compared with the rutile standard card of the ICSD collection (code 023697, see
Figure S1, Section S1, Supplementary Materials,). Potassium dichromate (K
2Cr
2O
7, 99.9%), perchloric acid (HClO
4, 70%), and phosphoric acid (H
3PO
4, 70%) were from Merck. Diphenylcarbazide (DPC) for analysis (UCB) was dissolved in acetone 99.5% (Anedra, Los Troncos del Talar, Argentina). Water was obtained from a Millipore Milli-Q purification system (resistivity = 18 MΩ·cm).
2.2. Adsorption Experiments
Aqueous K
2Cr
2O
7 solutions in the range 0.5 μM to 1.5 mM were prepared, and 1 g TiO
2 (P25, UV100, PC50 or rutile) was suspended in 1 L of each solution. Suspensions were magnetically stirred in the dark for 1 min with a Metrohm E649 stirrer (Metrohm, Herisau, Switzerland), adjusted to pH 2 with concentrated HClO
4, ultrasonicated for 2 min in a Cleanson CS-1109 ultrasound equipment (Cleanon S.R.L., Villa Maipú, Argentina), stirred for 30 min in order to attain the adsorption equilibrium [
22,
34] and filtered under vacuum through 47 mm cellulose acetate filters (Sartorius, pore size 0.22 µm). Strongly acidic conditions (pH 2) were selected in order to favor the adsorption of anionic Cr(VI) species on the positively charged TiO
2 surface (pH
ZPC ~ 6) [
36].
The solids were then washed with 3 mL Milli-Q water in order to eliminate the physisorbed Cr(VI) the assumption that chemisorbed Cr(VI) remained bound to the surface. Cr(VI) was quantified in the filtrates by the DPC method [
37]. Cr(VI) adsorption isotherms were evaluated for each TiO
2 sample by subtracting the Cr(VI) concentration in the filtrates ([Cr(VI)]
eq) from the concentration of the solution before TiO
2 addition ([Cr(VI)]
0), and also by reflectance measurements carried out as described in the next paragraph.
The solids resulting from each experiment were dried in a vacuum oven at ca. 65 °C for 24 h and milled to obtain homogeneous powders for which UV-visible diffuse reflectance spectra (DRS) were obtained. Diffuse reflectances,
R, of optically thick solid samples (3 mm thickness) were recorded as a function of wavelength on a Shimadzu UV-3101 scanning spectrophotometer (Shimadzu, Kyoto, Japan) equipped with an integrating sphere, using barium sulfate as the 100% reflectance reference. To prevent loss of the solid during the measurement, a glass plate (transmittance 0.90 ± 0.01 between 370 and 700 nm) was used to cover the sample; an identical plate was located in the reference compartment. Remission (Kubelka-Munk) functions (
F(
R)) were obtained from diffuse reflectances as
F(
R) = (1 −
R)
2/2
R [
38]. The remission function of adsorbed Cr(VI) was calculated by subtracting the remission function of the pure TiO
2 catalyst from the spectra of the samples.
2.3. Photocatalytic Experiments
Photocatalytic experiments were performed in a recirculating system composed of an annular photoreactor, a 380 mL reservoir kept at (25.0 ± 0.5) °C, and an Apema BS6 peristaltic pump (APEMA S.R.L., Villa Dominico, Argentina) operating at 1.5 L min
−1. The system was open to the atmosphere. The reservoir was fitted with a pH electrode and the E649 magnetic stirrer (Metrohm, Herisau, Switzerland). The photoreactor consisted of a black light blue tubular UV lamp (FL-BLB, 15 W, 25.5 mm o.d., Toshiba, Kanuma, Japan), allowing irradiation between 300 and 400 nm with maximum at 351 nm, which was in contact with the suspension, coaxially surrounded by a glass tube (415 mm length, 33 mm i.d.). The total volume of the circulating suspension was 500 mL, and the volume inside the photoreactor was ca. 150 mL. Actinometric measurements were performed at the cited wavelength range by the ferrioxalate method. A photon flux per unit volume (
q0n,p/
V) of 7.8 μeinstein s
−1 L
−1 was calculated within the whole irradiation interval.
Aqueous suspensions containing 1 g L
−1 TiO
2 (P25, UV100 or PC50) and 0.8 mM Cr(VI) ([Cr(VI)]
0) at pH 2 were prepared by following the procedure described above. At predetermined irradiation time intervals, 1.5 mL aliquots were withdrawn from the reservoir and, after centrifugation in an Eppendorf MiniSpin centrifuge (Eppendorf manufacturer, Hamburg, Germany) for 60 s at 13,400 rpm, Cr(VI) was quantified in the supernatant using the DPC method. Experiments were carried out until no Cr(VI) was detected. Reaching this point, an unfiltered aliquot was suspended in 10 mL DPC-H
3PO
4 solution to determine qualitatively if adsorbed Cr(VI) remained at the surface. If color was developed, the experiment continued until negative results were obtained (the sensitivity of the test was better than 2.5 nmol Cr(VI) mL
−1 suspension). At the end of the experiments, the suspension remaining in the recirculating system (nearly 500 mL) was filtered to gather the solids for analysis (see below); total chromium in the solid (Cr
TS) was determined by wavelength dispersive X-ray fluorescence (WDXRF) measurements, using a Venus 200 MiniLab WDXRF equipment (Panalytical, Almelo, Netherlands) with a Sc anode X-ray tube, with 50 kV and 4 mA as excitation conditions. Cr(III) in the filtered solution ([Cr(III)]) was calculated as the difference between [Cr(VI)]
0 and the sum of Cr
TS (multiplied by the TiO
2 concentration, see below) and the remaining Cr(VI) in solution ([Cr(VI)]). Each experiment was repeated at least twice, and the solids (~0.5 g each) were mixed to obtain the DRS at the end of the reaction. For P25, the same determinations were also carried out at intermediate times, including new duplicate experiments for each reaction time.
The solids remaining after the complete reduction of Cr(VI) in suspensions containing P25, PC50, or UV100 were filtered and dried following the same procedure applied to non-irradiated suspensions. A similar routine was followed at intermediate times for the Cr(VI)/P25 system. Blank experiments carried out under identical conditions but in the absence of TiO
2 did not yield any measurable reaction.
According to the stoichiometry of the reactions involved (see
Equation (2) and
Equation (3)), an increase in pH would be expected during the course of the process. However, pH was constant during the photocatalytic runs.
It is important to emphasize that the concentration of species in solution, expressed in μM, can be directly compared to the amount adsorbed on the photocatalysts, expressed in μmol g
−1, by simply multiplying the latter by the concentration of TiO
2 used in the experiments (1 g L
−1).
3. Results
3.1. Diffuse Reflectance and Remission Function Spectra after Adsorption in the Dark
DRS of the different Cr(VI)-loaded photocatalyst samples were obtained by previous filtration and drying after the adsorption equilibrium was attained in solutions of different initial Cr(VI) concentrations ([Cr(VI)]
0): (1) P25 (1 μM to 1 mM Cr(VI)); (2) UV100 (2.5 μM to 1.5 mM Cr(VI)); (3) PC50 (2.5 μM to 0.75 mM Cr(VI)), and (4) rutile (2.5 μM to 1 mM Cr(VI)). When [Cr(VI)]
0 ≤ 1.5 mM, the fraction of Cr(VI) in the form of HCrO
4− is ≥ 93%, calculated using the reported equilibrium constants, according to the equilibrium between the prevailing species in solution at pH 2 [
27]:
Therefore, the concentration ranges studied were selected in order to ensure adequate quantification of Cr(VI) concentrations by the DPC method and the presence of HCrO
4− as the main Cr(VI) species in solution at pH 2.
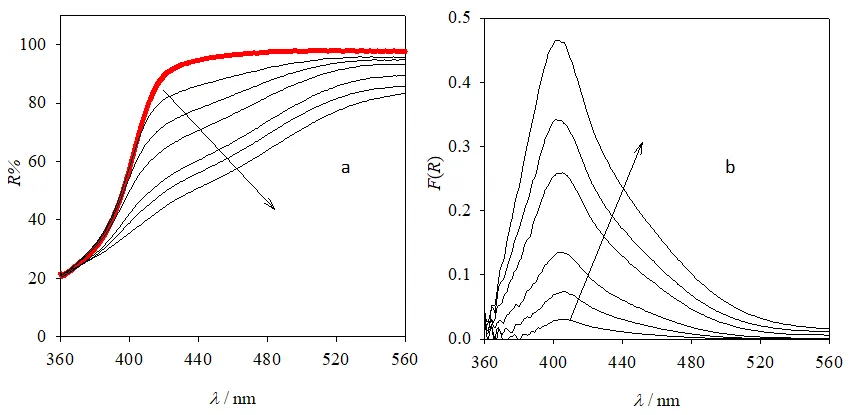
a shows the DRS of pure P25 (thick red line) and P25 after reaching the adsorption equilibrium with solutions containing Cr(VI) ([Cr(VI)]
0 = 2.5, 5, 10, 25, and 50 μM and 1 mM, thin black lines). Remission function spectra of the same samples after subtraction of the remission function of pure P25 are shown in
b. It is observed that the shape of the remission function spectra is independent of [Cr(VI)]
0, presenting a maximum around 400 nm. A similar behavior was observed for the remaining photocatalysts (see
Figure S2,
Figure S3 and
Figure S4, Section S2, Supplementary Materials).
. (<b>a</b>) DRS of pure P25 (thick red line) and P25 after adsorption equilibrium with solutions containing Cr(VI) ([Cr(VI)]<sub>0</sub> = 2.5, 5, 10, 25 and 50 μM and 1 mM, thin black lines); (<b>b</b>) remission function spectra of the same samples after subtraction of the remission function of pure P25. [Cr(VI)]<sub>0</sub> increases in the direction of the arrows.
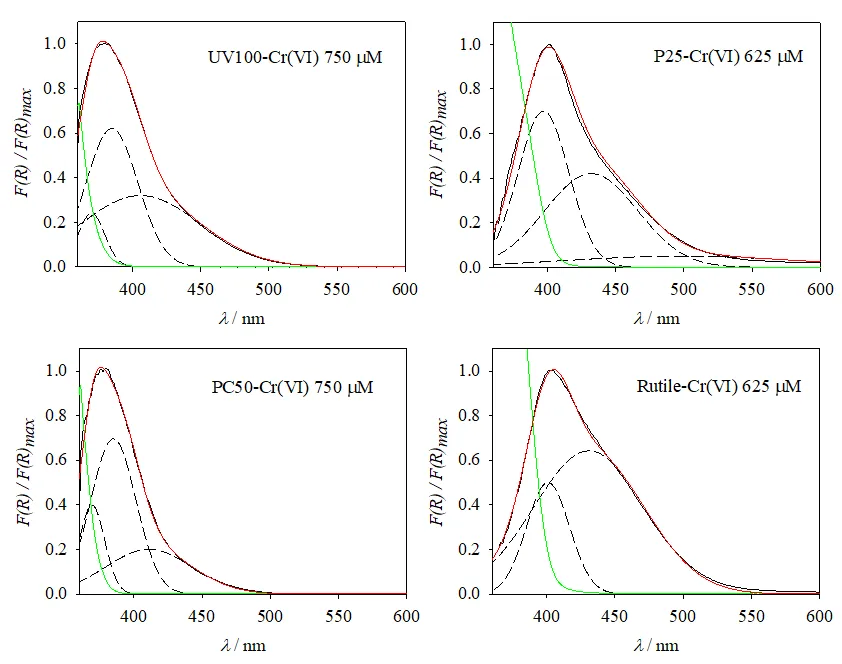
Normalized remission function spectra for P25, UV100, PC50, and rutile, calculated as the difference between the spectrum at high Cr(VI) concentrations (as a representative spectrum of the adsorbed Cr(VI) species in each case) and that of the bare photocatalyst, are presented in
. The spectra show maxima near 400 nm for P25 and rutile, and near 380 nm for UV100 and PC50. These spectra are quite different from the spectrum of Cr(VI) in solution at pH 2, which shows a maximum at 350 nm and a much weaker one near 450 nm [
39] and should then be attributed to chemisorbed Cr(VI) (see
Figure S5, Section S2, Supplementary Materials, for the comparison).
. Normalized remission function spectra of Cr(VI) adsorbed on the different catalysts (red lines), Gaussian components of the corresponding spectra (dashed lines, see text), the sum of Gaussian components (full black lines), and remission function spectra of the bare TiO<sub>2</sub> supports (green lines). Indicated concentrations refer to the [Cr(VI)]<sub>0</sub> used in the corresponding adsorption equilibrium experiment.
Spectra were analyzed by multiple Gaussian fittings (see Equations (S2) and (S3), Section S3, Supplementary Materials, and corresponding discussion in Section S3), and the best results are presented in
. Each spectrum was decomposed into two or three Gaussians. The model followed to develop the Gaussian analysis considers that the spectra of the adsorbed Cr(VI) species result from different Franck-Condon transitions from the same or different adsorbed species, with Gaussian-type inhomogeneous broadening [
40,
41]. Other models might be considered, but the excellent fittings found here constitute a first approach for spectral shape comparisons.
Individual fittings of the experimental spectra show only very slight deviations, consistent with
R2 > 0.99 in most cases. Fitting parameters for concentrations above 250 μM for each catalyst are shown in
Table S1 (Section S3, Supplementary Materials). The maxima of the two main components lie at (400 ± 3) and (432 ± 3) nm for P25 and rutile, and at (380 ± 5) and (407 ± 4) nm for UV100 and PC50. The relative weight of these components is different for each catalyst (see
Table S1, Section S3, Supplementary Materials).
shows that, remarkably, the short-wavelength Gaussian components for all catalysts peak at the same absorption onset wavelength of the naked semiconductor (see also Tauc plots and calculated optical band gaps of the semiconductors in
Figure S6, Section S3, Supplementary Materials).
From the spectral analysis (see Figure 2 and Figure S2, Figure S3, Figure S4 and Figure S5, Section S2, Supplementary Materials and
Table S1, Section S3, Supplementary Materials), it can be concluded that the same chemisorbed Cr(VI) species,
i.e., with the same absorption spectrum, is present in the anatase samples (UV100 and PC50) within the experimental error. The absorption in rutile is red-shifted (~20 nm), while the spectrum of P25 seems to be a combination of those observed in anatase and rutile. The minor, widest Gaussian component in P25 (centered at 506 nm) might have arisen from small baseline problems and/or some minimum involuntary activation of P25 (due to incidental exposure to low-intensity laboratory illumination during the sample processing [
28]). Irrespective of the differences, a common Gaussian component around 400 nm was obtained in all cases. For P25, the absorption bands at
λ < 400 nm observed for the pure anatase samples should be expected, but they could be masked by the strong absorption of the support above its optical band-gap (2.98 ± 0.02 eV (416 nm)), see
Figure S6, Section S3, Supplementary Materials).
3.2. Adsorption Equilibrium Studies
The amount of Cr(VI) adsorbed on the catalysts (
ω,
i.e., the Cr(VI) adsorption capacity) was obtained from the difference (Δ[Cr(VI)]) between [Cr(VI)]
0 and [Cr(VI)]
eq, determined by the DPC method (see Section 2.2) on the filtered solution after reaching equilibrium, divided by the TiO
2 concentration (1 g L
−1):
The saturation degree,
θ, was calculated as the ratio between
ω and
ωmax (the maximum Cr(VI) adsorption capacity). This parameter was also calculated as
F(
R)/
F(
R)
max, being
F(
R)
max the remission functions obtained at the maxima of Figure 1b, Figure S2b, Figure S3b and Figure S4b (Section S2, Supplementary Materials), considering the proportionality between
F(R) and the amount of adsorbed chromophore according to the Kubelka-Munk theory [
38].
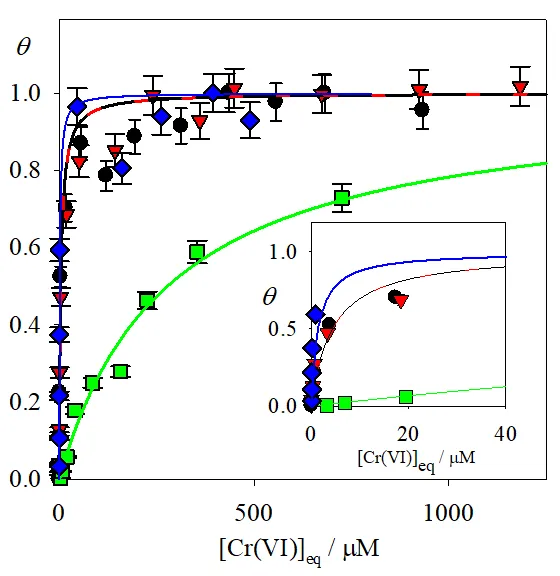
Figure S7 (Section S5, Supplementary Materials) confirms the similarity of these values. The relationship between
θ and [Cr(VI)]
eq can be properly fitted with a Langmuir isotherm model [
42]:
The values of
θ obtained using the ratio of
F(R) and its maximum can be observed in
.
. Saturation degree (<em>θ</em>, calculated as <em>F</em>(<em>R</em>)/<em>F</em>(<em>R</em>)<sub>max</sub>) <em>vs.</em> [Cr(VI)]<sub>eq</sub> for P25 (black circles), UV100 (red triangles), PC50 (green squares), and rutile (blue diamonds). Lines are Langmuir fittings (notice deviations at intermediate concentrations for P25, UV100, and rutile). The inset shows the details at low concentrations. Error bars correspond to estimated uncertainties of ±5% from duplicate measurements.
Structural properties, Langmuir parameters, and derived quantities for the different TiO
2 samples are presented in
. Notice the coincidence between the
KL values for P25 and UV100 ((2.3 ± 0.8) × 10
5 M
−1) while, for rutile,
KL was almost one order of magnitude higher ((19 ± 6) × 10
5 M
−1); for P25,
KL is similar to the value reported in the literature (3.42 × 10
5 M
−1 a pH 2.5) [
27]. The adjustment is apparently poor at intermediate concentrations, pointing to a complex adsorption behavior (e.g., dimerization of adsorbed Cr(VI) [
28] or nonspecific anticooperative binding effects [
43]). Lower
KL values were obtained from fittings using Δ[Cr(VI)] data ([Cr(VI)]
0 - [Cr(VI)]
eq) instead of
F(R)) for P25 ((0.56 ± 0.08) × 10
5 M
−1), UV100 ((0.52 ± 0.14) × 10
5 M
−1) and rutile ((7 ± 2) × 10
5 M
−1), most probably associated with experimental error on adsorbed Cr(VI) calculations near the saturation. On the contrary, no significant differences were obtained for PC50 ((3.8 ± 0.6) × 10
3 M
−1). The higher
KL values observed for rutile measured using both
F(R) and Δ[Cr(VI)] may be related to the removal of impurities present in the precursor (UV100) after the thermal treatment (650 °C, 2 h) used to prepare rutile (Section 2.1). The site density was calculated as the ratio of the maximum Cr(VI) adsorption capacity of the sample (considering monolayer coverage) and the BET surface area (
ωmax/S
BET); the area/Cr (nm
2) is the inverse of the site density multiplied by the Avogadro’s number (Site density ×
NA)
−1. Site densities in
were estimated considering that the whole BET surface area was available for Cr(VI) adsorption.
.
Structural properties of the different TiO2 samples and Cr(VI) adsorption parameters using the Langmuir isotherm.
| TiO2 |
Composition |
Crystallite Size (nm) |
SBET (a)
(m2 g−1) |
KL (b)
(M−1) |
ωmax (c)
(μmol g−1) |
R2 |
Site Density
(μmol m−2) |
Area/Cr
(nm2) |
| P25 |
anatase-rutile |
22 |
51 |
(2.3 ± 0.8) × 105 |
66 ± 2 |
0.97 |
1.29 ± 0.04 |
1.29 ± 0.04 |
| UV100 |
anatase |
13 |
289 |
(2.3 ± 0.8) × 105 |
313 ± 21 |
0.97 |
1.08 ± 0.07 |
1.54 ± 0.11 |
| PC50 |
anatase |
29 |
51 |
(3.8 ± 0.6) × 103 |
54 ± 4 |
0.98 |
1.06 ± 0.08 |
1.57 ± 0.12 |
UV100
(650 °C)
|
rutile |
--- |
--- |
(19 ± 6) × 105 |
237 ± 8 |
0.97 |
--- |
--- |
3.3. Photocatalytic Results and Remission Function Spectra after Irradiation
The photocatalytic reduction of Cr(VI) in aqueous suspensions of P25, UV100, and PC50 (TiO
2 concentration = 1 g L
−1) was studied as described in Section 2.3, starting from [Cr(VI)]
0 = 0.8 mM at pH 2. No photocatalytic experiments have been performed with rutile, as literature reports indicate that this form of TiO
2 presents a lower activity than pure anatase or P25 toward Cr(VI) photocatalytic reduction [
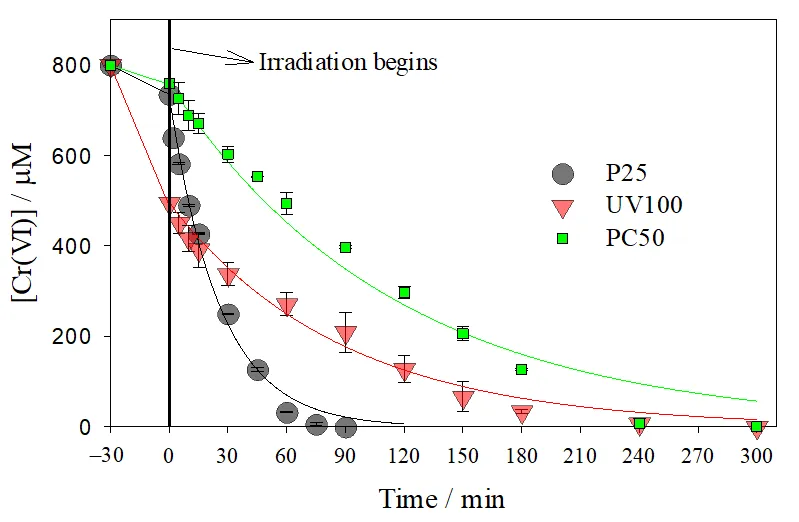
45]. The temporal profiles of the Cr(VI) concentration in solution are given in
.
. Temporal profiles of Cr(VI) concentration for the photocatalytic reduction over P25, UV100 and PC50. Initial conditions: [Cr(VI)]<sub>0</sub> = 0.8 mM, pH 2, TiO<sub>2</sub> concentration = 1 g L<strong><sup>−</sup></strong><sup>1</sup>, <em>T</em> = 25 °C, <em>q</em><sup>0</sup><em><sub>n</sub></em><sub>,p</sub>/<em>V</em> = 7.8 μeinstein s<sup>−1</sup> L<sup>−1</sup>. Full lines after 0 min are pseudo first-order fittings (<a href="#Equation11">Equation (11)</a>). Concentration decays between −30 and 0 min correspond to the dark adsorption of Cr(VI) over the photocatalysts.
As can be appreciated, P25 was the most efficient photocatalyst, achieving a complete Cr(VI) removal after 90 min of irradiation, while about 240 min were required for UV100 and PC50. During irradiation (
t ≥ 0 min), Cr(VI) decays can be roughly described by a pseudo first-order model (
Equation (11)).
In
Equation (11),
kCr(VI) is the pseudo first-order kinetic constant for the photocatalytic process, and [Cr(VI)]
eq is the Cr(VI) concentration after the adsorption equilibrium was reached before irradiation. As can be observed, a good fitting was obtained in all cases. However, in the final times, Cr(VI) concentrations are below the values predicted by the first-order model, thus showing that the kinetics has an apparent zero-order like component, being this effect being especially noticeable for PC50. Nevertheless, the use of a mixed zero- and first-order model only significantly improved
R2 for PC50 (see
Figure S8, and
Table S2, Section S6, Supplementary Materials), so the simpler pseudo first-order model was selected.
The fitting parameters of
Equation (11), together with the total concentration of chromium species on the photocatalyst surface at the end of the photocatalytic experiments (Cr
TS,f, μmol g
−1) are shown in
.
.
Equilibrium Cr(VI) concentration before irradiation ([Cr(VI)]eq), fitting parameters of Equation (11) and final total concentration of chromium species in the solid (CrTS,f) for the experiments of .
| TiO2 |
[Cr(VI)]eq (t = 0 min) (μM) |
kCr(VI) × 103
(min−1) |
R2 |
CrTS,f
(μmol g−1) |
| P25 |
735 |
39 ± 2 |
0.991 |
396 |
| UV100 |
496 |
11 ± 1 |
0.984 |
219 |
| PC50 |
760 |
8.6 ± 0.6 |
0.977 |
636 |
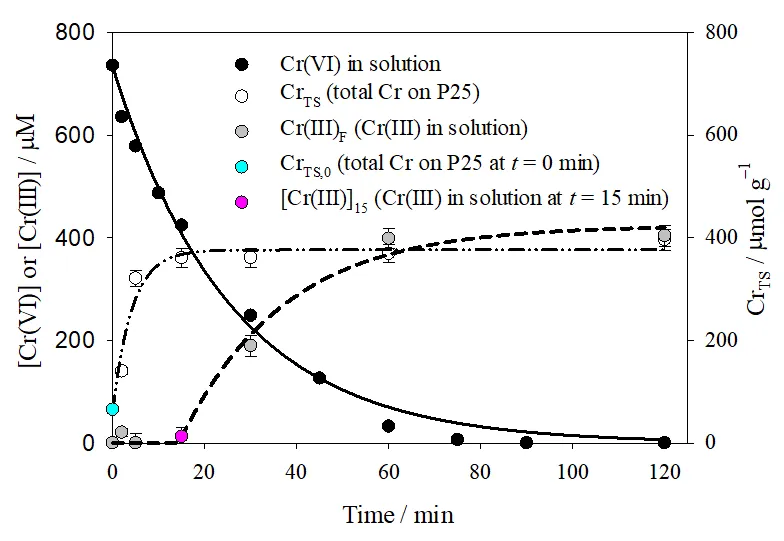
The temporal profile of Cr
TS, the evolution of [Cr(VI)], and that of Cr(III) concentration in solution ([Cr(III)]) are shown in
. [Cr(III)] was calculated as the difference between [Cr(VI)]
0 and [Cr(VI)] + [Cr
TS × TiO
2 concentration]. Cr
TS and [Cr(III)] (this concentration at
t ≥ 15 min) evolution follows a pseudo first-order growth kinetics, according to
Equation (12) and
Equation (13), respectively.
In
Equation (12), Cr
TS,0 is the initial amount of deposited Cr (calculated as the initially adsorbed Cr(VI)),
kCrTS is the pseudo first-order kinetic constant for Cr photocatalytic deposition over TiO
2, and Cr
S is the amount of chromium deposited over P25 due to the photocatalytic process, being Cr
TS,0 + Cr
S = Cr
TS,f. In
Equation (13), [Cr(III)]
15 is the Cr(III) concentration in solution after 15 min of irradiation (
i.e., when [Cr(III)] starts growing with time),
kCr(III)dis is the pseudo first-order kinetic constant for Cr(III) formation in solution and [Cr(III)]
dis is the concentration of Cr(III) in solution formed during the photocatalytic process, with [Cr(III)]
15 + [Cr(III)]
dis = [Cr(III)]
f. Cr
TS,0 and [Cr(III)]
15 were set as fixed parameters, with the experimental values obtained from
(65 μmol g
−1 and 12 μM, respectively).
. Temporal profiles of [Cr(VI)] and [Cr(III)] concentrations in solution, and total chromium over the photocatalyst surface (Cr<sub>TS</sub>, μmol g<sup>−1</sup>) formed during the photocatalytic reduction of Cr(VI) over P25. Experimental conditions of <a href="#Figure4"></a>. Full line: pseudo first-order fitting of Cr(VI) decay in solution (<a href="#Equation11">Equation (11)</a>); dashed-dotted line: pseudo first-order fitting of Cr<sub>TS </sub>evolution over P25 (<a href="#Equation12">Equation (12)</a>); dashed line: pseudo first-order fitting of [Cr(III)] evolution (<a href="#Equation13">Equation (13)</a>), calculated as the difference between [Cr(VI)]<sub>0</sub> and the sum of [Cr(VI)] and Cr<sub>TS</sub>.
The results in
indicate that, during the first 15 min of reaction, almost 50% of the initially present Cr(VI) was removed and retained over the P25 surface; at longer times, Cr
TS remains almost constant (Cr
TS,f), while [Cr(III)] starts to increase until [Cr(III)]
f = 424 μM was reached at the end of the reaction (
t = 120 min). The fitting parameters for the evolution of Cr
TS and [Cr(III)] using
Equation (12) and
Equation (13) are shown in
.
.
Fitting parameters of Equations (12) and (13) were used to model the results of CrTS and [Cr(III)], respectively, extracted from . Experimental conditions of .
| Equation (12) |
CrTS,0
(μmol g−1) |
kCrTS × 103
(min−1) |
CrS
(μmol g−1) |
R2 |
CrTS,f
(μmol g−1) |
|
65 |
239 ± 51 |
311 ± 15 |
0.952 |
376 |
| Equation (13) |
[Cr(III)]0
(μM)
|
kCr(III)dis × 103
(min−1)
|
[Cr(III)]dis
(μM)
|
R2 |
[Cr(III)]f
(μM)
|
|
12 |
44 ± 10 |
412 ± 30 |
0.972 |
424 |
Results of
indicate that, besides [Cr(VI)], Cr
TS and [Cr(III)] evolutions can also be modeled according to a pseudo first-order kinetics with reasonably good
R2 values. Within the fitting error,
kCr(VI) (0.039 min
−1,
) and
kCr(III)dis (0.044 min
−1,
) can be considered identical, while
kCrTS (0.239 min
−1,
) is larger. These results are in agreement with the rapid formation of a chromium deposition layer during the photocatalytic process that reaches a plateau after 15 min, while Cr(VI) decay in solution continues up to 90 min. Within the experimental error (±10%), Cr
TS,f (376 μmol g
−1), calculated from the fitting parameters of
Equation (12), is identical to the experimental value reported in
(396 μmol g
−1) measured at the end of the photocatalytic experiment. As can be observed, the sum of Cr
TS,f (multiplied by the TiO
2 concentration, 1 g L
−1) and [Cr(III)]
f equals [Cr(VI)]
0, reflecting the consistency of the chromium mass balance.
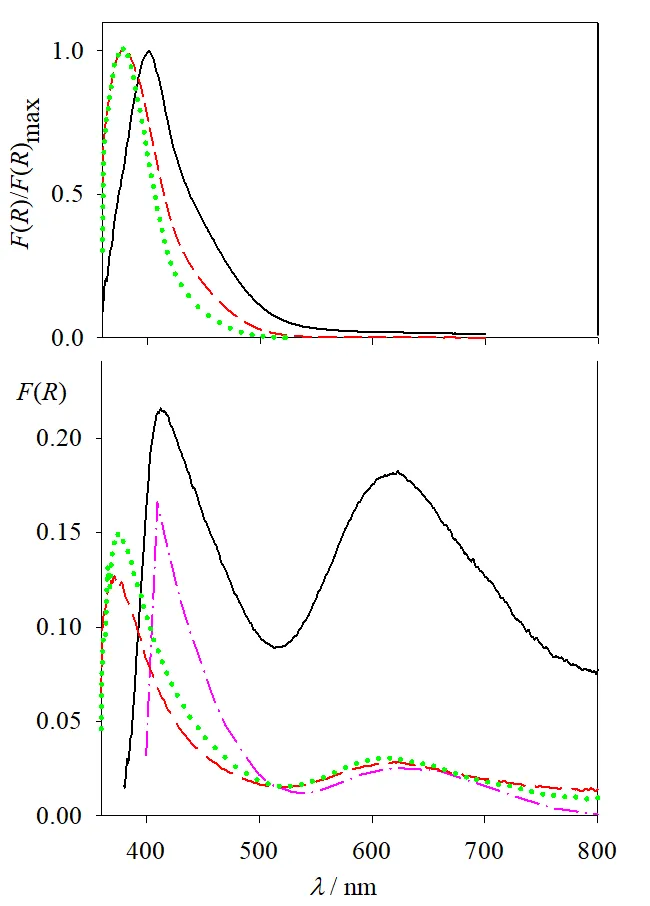
Remission function spectra of the solids before irradiation and after total Cr(VI) depletion are shown in
(upper and lower panels, respectively), together with that of Cr(III)-grafted rutile in a Cr
2O
3-like conformation (calculated from diffuse reflectance data in [
46]). The remission function spectra after Cr(VI) depletion show two bands, one around 400 nm for UV100 and PC50 and 410 nm for P25, and a new one around 620–630 nm. The short wavelength bands are almost identical to the ones observed in
; as Cr(VI) was completely removed from the system, they can be assigned to Cr(III) deposited over TiO
2 after the photocatalytic reaction. On the other hand, the position of the 620–630 nm band does not depend on the nature of the TiO
2 sample, although the intensity is much higher for P25.
. Upper panel: normalized difference remission function spectra of the semiconductors before irradiation (see <a href="#Figure2"></a>) for P25 (solid black line), UV100 (dashed red line), and PC50 (dotted green line). Lower panel: remission function spectra of the semiconductors after Cr(VI) has been thoroughly depleted. The dash-dotted pink line corresponds to the spectrum calculated from [<a href="#B46" class="html-bibr">46</a>] for Cr(III)-grafted rutile (see text).
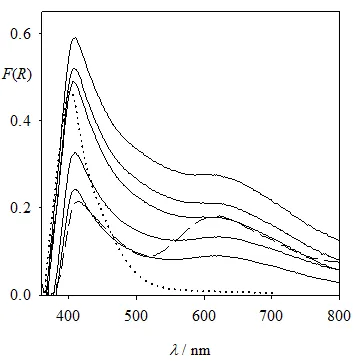
For P25, the remission function of the solid was obtained at different time intervals during illumination, after subtracting the spectrum of pure P25 as the blank. Results, shown in
, can be analyzed in comparison with the Cr(VI) and Cr
TS evolutions (
). Drastic changes are observed during the first 100 s and at 120 min (after Cr(VI) depletion). As shown in
, for P25, a monolayer amounts to 66 μmol Cr(VI)/g TiO
2. Although it is not possible to conclude exactly how much Cr(VI) remains on the solid, the decay in absorption at 400 nm (
) shows that more than 50% of the monolayer is transformed during the first 100 s. While the increase in absorption around 620 nm can be attributed to Cr(III) generation, the overall increase of absorption between 400 and 800 nm cannot be assigned to Cr(VI) adsorbed over TiO
2. Therefore, the spectra at
t = 100 s and 5, 15, 30 and 60 min would reflect these three consecutive processes: (1) reduction of adsorbed Cr(VI), (2) formation of Cr(III) over the photocatalyst and (3) adsorption of Cr(VI) over the deposited Cr(III) layer, together with partial Cr(III) redissolution (as indicated by the results of
). Otherwise, the large change in the spectrum after 60 min, when almost all Cr(VI) has been reduced, cannot be interpreted.
. Remission function of the solid after Cr(VI) reduction by photocatalysis over P25 as a function of time; <em>t</em> = 0 (dotted line), <em>t</em> = 100 s and 5, 15, 30, 60 min from bottom to top (full lines), <em>t </em>= 120 min (dashed line). The spectrum of pure P25 as the blank was subtracted in all cases.
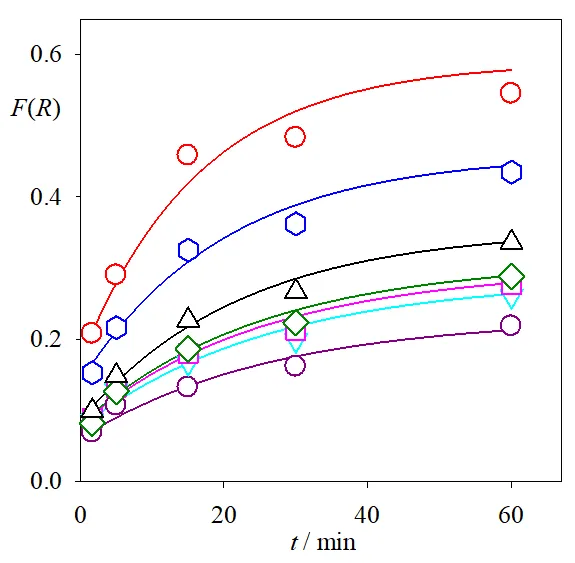
The temporal evolution of the remission functions of
was analyzed at different wavelengths (
).
. Temporal evolution of the remission functions of the solid after Cr(VI) reduction by photocatalysis over P25 at 400 (red circles), 450 (blue hexagons), 500 (upward black triangles), 550 (green diamonds), 600 (pink squares), 650 (downward cyan triangles), and 700 nm (lower dark pink circles). Full lines: exponential fittings (see text), excluding the points at <em>t </em>= 0 and <em>t </em>= 120 min.
At intermediate times (
t = 100 s and 5, 15, 30, 60 min) and at all wavelengths, the remission function grew nearly exponentially, according to
Equation (14).
where
krem is the rate constant for the evolution of the remission function. The values obtained for
krem ranged from 0.04 min
−1 (at 600–700 nm) to 0.06 min
−1 (at 400 nm), similar to the value of
kCr(VI) (0.039 min
−1,
) and
kCr(III)dis (0.044 min
−1,
).
4. Discussion
In agreement with previous reports [
27,
47], the adsorption of Cr(VI) over the different TiO
2 samples here studied (P25, UV100, PC50 and rutile) can be described by a Langmuir isotherm, assuming monolayer adsorption. The inverse of the area/Cr values in
indicates the site density in Cr ions per nm
2 in adsorption saturation conditions. The results obtained here are compared with estimated values from reference data in
.
.
Comparison of adsorption site densities of Cr(VI) over TiO2 (without irradiation) obtained in this work with those estimated from reference data.
| Support |
pH |
Site Density
(Cr Ion nm−2) |
Reference |
| P25 |
2 |
0.78 ± 0.02 |
This work |
| UV100 |
2 |
0.65 ± 0.05 |
This work |
| PC50 |
2 |
0.64 ± 0.05 |
This work |
| P25 |
2.5 |
1.44 |
[45] |
| P25 |
2–4 |
0.05–0.14 |
[48] |
| P25 |
2.7 |
0.27 |
[31] |
| P25 |
2.5 |
0.16–1.2 |
[27] |
| Hydrous anatase |
1.5 |
0.17 |
[49] |
| Rutile |
5.58 |
1.66 |
[50] |
| Rutile |
1 |
0.2 |
[32] |
| Rutile |
8 |
0.7 |
[51] |
| Rutile |
3.6 |
0.87 |
[52] |
| Amorphous TiO2 |
2 |
0.31 |
[47] |
According to the values in
, a concentration density range between 0.05 and 1.66 Cr ion nm
−2 can be established for Cr(VI) adsorption over TiO
2 under acidic conditions, the differences being attributable to differences in crystalline structure and experimental conditions (e.g., ionic strength, type of acid used,
etc.). These values are somewhat lower than the 2.31 sites nm
−2 estimated for Cr(VI) adsorption over different minerals [
53]. Assuming a uniform distribution in a square grid, a mean distance of (12 ± 1) Å between adsorbed Cr(VI) can be calculated using the area/Cr values in
. This value is in agreement with the 14.1–37.3 Å range reported by Weng et al. [
27] but exceeds the HCrO
4− dimensions (2.4–2.7 Å [
54]). The differences between experimental and theoretical site densities and adsorption site distances can be attributed to the compensation between a chemical stabilization by Cr(VI) adsorption and the electrostatic repulsion between adjacent negatively-charged adsorbed species; this last effect is especially noticeable at intermediate concentrations where significant deviations from the Langmuir isotherm were observed (
).
The values of the adsorption constant
KL (see
) above 10
3 M
–1 (in agreement with the literature [
49]) indicate that the process can be considered a chemisorption [
27]. The formation of a Cr(VI)-TiO
2 complex during the adsorption of chromium on TiO
2 has been previously reported by our group and others [
28,
29,
30,
31,
32]. The differences in
KL values for the different samples can be explained by considering the effect of the crystalline quality on the surface complexation ability. Both UV100 and PC50 are composed of pure anatase. As the surface area of UV100 is more than five times higher,
i.e., corresponding to a smaller crystallite size [
44], the fraction of undercoordinated surface Ti atoms and, thus, the probability of formation of the complex are increased. P25 has a relatively similar surface area and crystallite size as PC50, but it is a polycrystalline mixture of rutile and anatase, which facilitates the formation of surface-bound complexes [
55], explaining the higher
KL values. Besides, rutile has a higher capacity to accumulate chromium on the surface than anatase (20.5
vs. 12.2 at%, respectively) [
56]. Cr(III) adsorption on anatase is less thermodynamically favored than that of Cr(VI), showing a 0.16 ion nm
−2 site density 49], lower than the one reported for Cr(VI) (see
).
shows the deconvolution of the normalized remission function spectra of Cr(VI) adsorbed on the different catalysts into two or three components. The figure shows two main components of the rutile-containing samples (
i.e., rutile and P25) ≈ 20 nm red-shifted compared with the anatase ones (PC50 and UV100), similar to the difference between their absorption onsets (
ca. 25 nm). For all samples, the short-wavelength Gaussian main component peaks close to the optical band-gap wavelength of the naked semiconductors (
Figure S6, Section S3, Supplementary Materials). If this apparent correlation reflects the direct excitation of charge-transfer states in a Cr(VI)-TiO
2 surface complex or results from the absorption of adsorbed Cr(VI) masked by the intense support absorption above its band-gap requires thorough quantum-chemical calculations, which are out of the scope of the present work (see a brief discussion in Section S4). Nevertheless, all results point to the occurrence of a strong interaction between Cr(VI) and the surface of the catalysts.
The results of
and the
kCr(VI) values in
show that P25 is more efficient for the photocatalytic removal of Cr(VI), in agreement with literature reports (e.g., [
57]). Faster recombination rates, together with lower surface areas and surface affinities, will reduce the photocatalytic activity of TiO
2 towards Cr(VI) reduction. PC50 shows the lowest adsorption affinity (see
KL values in
); however, the higher crystallinity of the sample results in longer charge-carrier lifetimes compared with UV100 [
44]. As the same reaction time (240 min) was required for complete Cr(VI) removal over UV100 and PC50 (
), it can be concluded that both factors have similar importance. This is not the case for P25, as the presence of mixed anatase-rutile phases greatly enhanced charge-carriers separation (e
CB− migrate to anatase and h
VB+ to rutile) [
58]. Moreover, as rutile is a more efficient water oxidant than anatase, generating peroxo species instead of HO
• [
59], its presence in the photocatalyst decreases the possibility of reoxidation of reduced chromium species (
Equation (4)).
Under the present experimental conditions (acid pH and air), Cr(VI) will be the preferential e
CB− scavenger, due to the more positive redox potential (
vs. SHE) of the one-electron Cr(VI) reduction couple (
E0Cr(VI)/Cr(V) = 0.55 V) compared with that of molecular oxygen (
E0O2/O2− = −0.33 V [
1]) and a higher reaction rate [
1,
30]. As e
CB− mediated O
2 reduction is the only mechanism that generates H
2O
2 in TiO
2 photocatalysis [
60], the possible contribution of H
2O
2 to Cr(VI) reduction [
61] can be ruled out. As reflected by the Cr
TS,f values of
, the reduced Cr(VI) is partially kept on the TiO
2 surface, with a retention of 49.5%, 27.4% and 79.5% of the initial Cr(VI) (calculated as {[Cr
TS,f × TiO
2 concentration]/[Cr(VI)]
0} × 100, where [Cr(VI)]
0 = 0.8 mM) for P25, UV100 and PC50, respectively. The retention value for P25 is similar (within the experimental error) to the 37.5% observed in a previous work under similar conditions [
26]. Complete Cr(III) deposition over the photocatalyst was reported when e
CB− was the only Cr(VI) reductive species [
51,
62].
According to thermodynamic data, at pH 2 Cr(III) should be in solution as Cr
3+ cations (log
Ksp = 9.35 for the reaction Cr(OH)
3(am) + 3 H
+ ⇌ Cr
3+ + 3 H
2O [
63]). However, the presence of Cr(III) over the photocatalysts can be attributed to the inertness of the Cr(III) species, caused by the strong Cr(III)-O bond [
53] and reflected by its low complexing [
64], hydrolyzing [
65] and Cr(OH)
3 dissolution [
53] rates. Moreover, it has been hypothesized that the presence of Cr(VI) in the suspension inhibits Cr(OH)
3 dissolution [
53]. Thus, it can be assumed that, during the photocatalytic experiments, once Cr(III) is formed over the TiO
2 surface, it is retained under a non-equilibrium condition, changing the surface properties of TiO
2 [
28], as reflected by the drastic change in
F(R) of P25 during the first 100 s (
). The presence of Cr(III) on the TiO
2 surface decreases the charge-carrier lifetimes [
26,
34] and inhibits O
2 from acting as e
CB− scavenger [
22], deactivating the photocatalyst and inhibiting Cr(VI) adsorption over the TiO
2. A Langmuir-type isotherm for Cr(VI) chemisorption over Cr(OH)
3 through a Cr(III)-O-Cr(VI) bond [
39] and/or Cr(VI)-Cr(III) co-precipitation has been proposed [
53]. The presence of Cr(VI) adsorbed over Cr(OH)
3 can be responsible for the increase in the absorbance at intermediate times (before Cr(VI) depletion) observed in
and
. Although Cr(V) and Cr(IV) species absorb in the same region [
66,
67], they would readily decay into Cr(VI) and Cr(III) [
1]. Once adsorbed over Cr(OH)
3, Cr(VI) can still be reduced by e
CB−, leading thus to the growth of a Cr(OH)
3 multilayer on the TiO
2 surface. Indeed, final Cr surface densities (calculated from Cr
TS,f,
) of 7.5 Cr atom nm
−2 for PC50 and 4.7 Cr atom nm
−2 for P25 were obtained, 12 and 6 times higher than the site density obtained for Cr(VI) adsorption (
). As the experiments were performed at 25 °C, within the time scale of the experiments, this Cr(OH)
3 layer would be a porous, gel-like structure [
39,
65], with a high capacity of retaining Cr(VI), but with a very slow equilibrium rate [
39]. This observation is in agreement with the slower formation rate of the Cr(VI)-TiO
2 complex once Cr(VI) reduction took place [
30]. An increase in the Cr content due to the photocatalytic process can be calculated from literature reports; e.g., from 0.34 to 2.8 ion nm
−2 (calculated from data of
and
in ref. [
51]), or from 0.87 to 60.9 ion nm
−2 (using a BET surface area of 224.4 m
2 g
−1 and results from
and Cr
TS,f of 1180 mg g
−1 in ref. [
52]).
This increase in the site density can be attributed to the generation of a Cr(III) multilayer, whose generation reinforces the assumption that the Cr(VI) adsorbed over Cr(III) can be reduced by e
CB−; otherwise, if Cr(VI) were reduced in solution, it would not be retained over the TiO
2 surface.
Under the studied experimental conditions, the following assumptions can be made: (i) mass-transfer is not a rate-limiting step [
19]; (ii) the formation of Cr(VI)-TiO
2 complexes and the subsequent reaction between trapped e
CB− and Cr(VI) are fast processes [
30]; and (iii) based on the adsorption constants (
KL values in
), the TiO
2 surface (for both P25 and UV100) should be nearly saturated with Cr(VI) until [Cr(VI)] ≤ 80 μM. Consequently, the reaction would be expected to follow zero-order kinetics during at least the first 60 min. However, Cr(VI) decay is better described as a first-order process, as observed here and also by other authors [
15,
45]. This discrepancy can be attributed to the presence of Cr(III) on the TiO
2 surface, which promotes the charge-carrier recombination and inhibits the Cr(VI) adsorption, thereby reducing the Cr(VI) removal rate. At the same time, this Cr(III) layer serves as a new adsorption site for Cr(VI). Thus, the overall Cr(VI) removal rate becomes limited by the slow adsorption of Cr(VI) onto the Cr(OH)
3 layer formed on the surface. Furthermore, the thickness of the Cr(OH)
3 layer grows during the photocatalytic process. However, although it increases due to the Cr(VI) reduction by e
CB−, it also decreases due to the slow Cr(III) leaching into the solution. The net change in the layer thickness depends on several factors, including the current size of the Cr(OH)
3 layer, the Cr(VI) concentration in the solution, and possibly the rate of charge-carrier recombination and/or photodesorption [
68,
69].
As evident, the reaction mechanism for the photocatalytic reduction of Cr(VI) is quite complex. Therefore, a detailed kinetic model would only be applicable under specific conditions. In the current system, the reaction rate appears to be governed primarily by the slow adsorption of Cr(VI) onto the Cr(OH)
3 deposition layer, resulting in a linear dependence of the rate on the Cr(VI) concentration in solution.
5. Conclusions
The photocatalytic reduction of 0.80 mM Cr(VI) in water at pH 2 using TiO2 under UV illumination shows a nearly pseudo first-order rate law. These results may be erroneously interpreted considering a simple Langmuir-Hinshelwood mechanism, from which static Langmuir adsorption parameters can be obtained. The results presented here clearly show that the adoption of a simple Langmuir-Hinshelwood mechanism may lead to severe errors because, actually, a complex photocatalytic mechanism is evidenced. Three consecutive processes take place during photocatalysis: (1) rapid reduction of adsorbed Cr(VI) to Cr(III) on illumination (under initial surface saturation conditions), (2) deposition of Cr(III) at the surface of TiO2 and (3) adsorption of Cr(VI) over the deposited Cr(III) layer, together with partial Cr(III) redissolution. This mechanism leads to the observed pseudo first-order rate law and is a very important result of the present work, never mentioned before. Due to the complexity and the apparent lack of thermodynamic equilibrium during the photocatalytic process, a quantitative evaluation of each step exceeds the scope of the present work. On the other hand, Cr(VI) adsorption affinities obtained in the dark could be rationalized considering the capabilities of the different TiO2 samples for the formation of a Cr(VI)-TiO2 surface complex. Reflectance spectral analysis reveals that Cr(VI) forms chemisorbed complexes on TiO2 surfaces with distinct absorption features that vary depending on the crystalline phase. While anatase-based materials (UV100 and PC50) show consistent spectral signatures, rutile-containing samples (P25 and rutile) exhibit a red-shifted absorption, in line with differences in their band structure. These findings support the formation of surface charge-transfer complexes and highlight the role of semiconductor band alignment in modulating the absorption behavior. P25 shows a better performance than UV100 and PC50, indicating that the anatase-rutile heterojunction is crucial for improving the photocatalytic activity, as generally accepted. The fate of the reduced Cr(III) and the impact of Cr(III) deposition on the photocatalytic activity are largely overlooked in the literature of Cr(VI) photocatalytic removal.
The experimental evidence that heterogeneous photocatalysis can reduce Cr(VI) with simultaneous total chromium removal under acidic conditions, as observed in the present work, is a clear advantage over other Cr(VI) reduction processes and can be envisaged as a potential real-scale application of this technology.
Supplementary Materials
The following supporting information can be found at:
https://www.sciepublish.com/article/pii/602. Section S1: Diffraction spectrum of the rutile sample (UV100 calcined at 650 °C).
Figure S1: XRD spectrum of the rutile sample. Section S2: Diffuse reflectance spectra of the Cr(VI)-TiO
2 complex formed using different samples.
Figure S2: (a) Diffuse reflectance spectra of pure UV100 and UV100 after adsorption equilibrium with solutions containing different [Cr(VI)]
0; (b) remission function spectra of the same samples after subtraction of the remission function of pure UV100.
Figure S3: (a) Diffuse reflectance spectra of pure PC50and PC50 after adsorption equilibrium with solutions containing different [Cr(VI)]
0; (b) remission function spectra of the same samples after subtraction of the remission function of pure PC50.
Figure S4: (a) Diffuse reflectance spectra of a pure rutile sample and a rutile sample after adsorption equilibrium with solutions containing different [Cr(VI)]
0; (b) remission function spectra of the same samples after subtraction of the remission function of pure rutile support.
Figure S5: Normalized remission function spectra of Cr(VI) adsorbed on P25, UV100, PC50, and rutile supports, compared with the absorption spectrum of 250 μM Cr(VI) at pH 2. Section S3: Equations used for multiple Gaussian fittings.
Table S1: Multiple Gaussian fitting parameters for initial Cr(VI) concentrations above 250 μM.
Figure S6: Tauc plots obtained from diffuse reflectance spectra and calculated optical band gaps for the naked supports. Section S4: Discussion about the Cr(VI)-TiO
2 absorption spectra. Section S5: Cr(VI) adsorption equilibria over the different TiO
2 samples.
Figure S7: Compared calculated saturation degrees (
θ) of Cr(VI) adsorption equilibrium on (a) P25, (b) UV100, (c) PC50, and (d) rutile. Inset: same data in the 0–20 μM range for P25, UV100, and PC50, and 0–1.5 μM range for rutile. Section S6: Comparison between the pseudo first-order and the mixed zero- + first-order models for the photocatalytic reduction of Cr(VI) over the different TiO
2 samples.
Figure S8: Temporal profile of normalized Cr(VI) concentration for the photocatalytic reduction over P25, UV100, and PC50.
Table S2: Fitting parameters of Equations (S4) and (S5) taken from
Figure S8.
Author Contributions
Conceptualization: M.A.G., E.S.R. and M.I.L.; Methodology: J.M.M., H.B.R., E.S.R. and M.I.L.; Software: J.M.M. and H.B.R.; Validation: J.M.M. and H.B.R.; Investigation: M.A.G., E.S.R. and M.I.L.; Writing—Original Draft Preparation: J.M.M., H.B.R., E.S.R. and M.I.L.; Writing—Review & Editing: J.M.M., H.B.R., E.S.R. and M.I.L.; Supervision: M.A.G., E.S.R. and M.I.L.; Funding Acquisition: M.I.L.
Ethics Statement
Not applicable.
Informed Consent Statement
Not applicable.
Data Availability Statement
The authors confirm that the data supporting the findings of this study are available within the article and its Supplementary Materials. Raw data are available from the authors, upon reasonable request.
Funding
This research was funded by Agencia Nacional de la Promoción de la Ciencia y Tecnología de Argentina (ANPCyT), PICT-06 512, 2011-0463 and PICT-015-0208 projects.
Declaration of Competing Interest
The authors declare that they have no known competing financial interests or personal relationships that could have appeared to influence the work reported in this paper.
List of Abbreviations
[Cr(VI)]: Cr(VI) concentration in solution.
[Cr(VI)]0: initial Cr(VI) concentration in solution (before TiO2 addition).
[Cr(VI)]eq: Cr(VI) concentration in solution after the adsorption equilibrium was reached.
[Cr(III)]: Cr(III) concentration in solution.
[Cr(III)]15: concentration of Cr(III) in solution after 15 min of the photocatalytic experiment.
[Cr(III)]dis: concentration of Cr(III) released to the solution by the photocatalytic experiment between t = 15 min and the end of the irradiation.
[Cr(III)]f: concentration of Cr(III) in solution at the end of the photocatalytic experiment.
CrTS: total chromium on the photocatalyst surface.
CrTS,0: total chromium on the photocatalyst surface before the photocatalytic experiment.
CrS: total chromium deposited on the photocatalyst due to the photocatalytic process.
CrTS,f: total chromium on the photocatalyst surface at the end of the photocatalytic experiment.
DPC: diphenylcarbazide.
DRS: UV-visible diffuse reflectance spectra.
F(R): Remission (Kubelka-Munk) function.
F(R)max: maximum of the remission function.
KL: Langmuir adsorption equilibrium constant.
kCr(VI): pseudo first-order kinetic constant for the photocatalytic Cr(VI) removal from solution.
kCr(III)dis: pseudo first-order kinetic constant for the photocatalytic Cr(III) formation in solution.
kCrTS: pseudo first-order kinetic constant for the photocatalytic deposition of Cr over the TiO2.
krem: pseudo first-order kinetic constant for the increase in F(R) during the photocatalytic experiment.
Ksp: solubility equilibrium constant
$$q_{n,\mathfrak{p}}^0/V$$: photon flux per unit volume.
SBET: BET surface area.
ω: Cr(VI) adsorption capacity of the TiO2 sample.
ωmax: maximum Cr(VI) adsorption capacity of the TiO2 sample.
WDXRF: wavelength dispersive X-ray fluorescence.
XRD: X-ray diffraction.
References
-
1.
Litter MI, Quici N, Meichtry JM, Senn AM. Photocatalytic removal of metallic and other inorganic pollutants. In Photocatalysis: Applications, 1st ed.; Dionysiou DD, Li Puma G, Ye J, Schneider J, Bahnemann D, Eds.; The Royal Society of Chemistry: Cambridge, UK, 2016; Volume 1, pp. 35–71. doi:10.1039/9781782627104-00035.
-
2.
WHO (World Health Organization). Chromium in drinking-water. In Background Document for Development of WHO Guidelines for Drinking-Water Quality; World Health Organization: Geneva, Switzerland, 2020.
-
3.
Imdad S, Dohare RK, Agarwal M, Srivastava A. Efficient removal of Cr(VI) from wastewater using recycled polymer-based supported ionic liquid membrane technology.
Sep. Purif. Technol. 2023,
327, 124908. doi:10.1016/j.seppur.2023.124908.
[Google Scholar]
-
4.
Islam JB, Furukawa M, Tateishi I, Katsumata H, Kaneco S. Photocatalytic Reduction of Hexavalent Chromium with Nanosized TiO
2 in Presence of Formic Acid.
ChemEngineering 2019,
3, 33. doi:10.3390/chemengineering3020033.
[Google Scholar]
-
5.
Song Y, Lu X, Liu Z, Liu W, Gai L, Gao X, et al. Efficient Removal of Cr(VI) by TiO
2 Based Micro-Nano Reactor via the Synergy of Adsorption and Photocatalysis.
Nanomaterials 2022,
12, 291. doi:10.3390/nano12020291.
[Google Scholar]
-
6.
Barrera-Díaz CE, Lugo-Lugo V, Bilyeu B. A review of chemical, electrochemical and biological methods for aqueous Cr(VI) reduction.
J. Hazard. Mater. 2012,
223–224, 1–12. doi:10.1016/j.jhazmat.2012.04.054.
[Google Scholar]
-
7.
Ohtani B, Prieto-Mahaney OO, Li D, Abe R. What is Degussa (Evonik) P25? Crystalline composition analysis, reconstruction from isolated pure particles and photocatalytic activity test.
J. Photochem. Photobiol. A Chem. 2010,
216, 179–182. doi:10.1016/j.jphotochem.2010.07.024.
[Google Scholar]
-
8.
Litter MI. Heterogeneous Photocatalysis: Transition metal ions in photocatalytic systems.
Appl. Catal. B 1999,
23, 89–114. doi:10.1016/S0926-3373(99)00069-7.
[Google Scholar]
-
9.
Litter MI. Treatment of chromium, mercury, lead, uranium and arsenic in water by heterogeneous photocatalysis.
Adv. Chem. Eng. 2009,
36, 37–67. doi:10.1016/S0065-2377(09)00402-5.
[Google Scholar]
-
10.
Litter MI. Last advances on TiO
2-photocatalytic removal of chromium, uranium and arsenic.
Curr. Opin. Green Sustain. Chem. 2017,
6, 150–158. doi:10.1016/j.cogsc.2017.04.002.
[Google Scholar]
-
11.
Acharya R, Naik B, Parida K. Cr(VI) remediation from aqueous environment through modified-TiO
2-mediated photocatalytic reduction.
Beilstein J. Nanotechnol. 2018,
9, 1448–1470. doi:10.3762/bjnano.9.137.
[Google Scholar]
-
12.
Kretschmer I, Senn AM, Meichtry JM, Custo G, Halac EB, Dillert R, et al. Photocatalytic reduction of Cr(VI) on hematite nanoparticles in the presence of oxalic and citric acids.
Appl. Catal. B 2019,
242, 218–226. doi:10.1016/j.apcatb.2018.09.059.
[Google Scholar]
-
13.
Zhao B, Zhang K, Huang Y, Wang Q, Xu H, Wang Y, et al. A novel visible light-driven TiO
2 photocatalytic reduction for hexavalent chromium wastewater and mechanism.
Water Sci. Technol. 2021,
83, 2135–2145. doi:10.2166/wst.2021.116.
[Google Scholar]
-
14.
Djellabi R, Su P, Elimian EA, Poliukhova V, Nouacer S, Abdelhafeez IA, et al. Advances in photocatalytic reduction of hexavalent chromium: From fundamental concepts to materials design and technology challenges.
J. Water Process Eng. 2022,
50, 103301. doi:10.1016/j.jwpe.2022.103301.
[Google Scholar]
-
15.
Anthony ET, Oladoja NA. Process enhancing strategies for the reduction of Cr(VI) to Cr(III) via photocatalytic pathway.
Environ. Sci. Pollut. Res. 2022,
29, 8026–8053. doi:10.1007/s11356-021-17614-z.
[Google Scholar]
-
16.
Marques Neto JO, Bellato CR, Silva LA. Removal of chromium from aqueous solution by CLCh/Fe/MWCNT/TiO
2-Ag magnetic composite film: Simultaneous Cr(VI) reduction and Cr(III) adsorption.
J. Photochem. Photobiol. A Chem. 2024,
448, 115326. doi:10.1016/j.jphotochem.2023.115326.
[Google Scholar]
-
17.
Loeb SK, Alvarez PJJ, Brame JA, Cates EL, Choi W, Crittenden J, et al. The Technology Horizon for Photocatalytic Water Treatment: Sunrise or Sunset?
Environ. Sci. Technol. 2019,
53, 2937–2947. doi:10.1021/acs.est.8b05041.
[Google Scholar]
-
18.
Meichtry JM, Rivera V, Di Iorio Y, Rodríguez HB, San Román E, Grela MA, et al. Photoreduction of Cr(VI) using hydroxoaluminumtricarboxymonoamide phthalocyanine adsorbed on TiO
2.
Photochem. Photobiol. Sci. 2009,
8, 604–612. doi:10.1039/B816441J.
[Google Scholar]
-
19.
Alam M, Montalvo RA. Titania-assisted photoreduction of Cr(VI) to Cr(III) in aqueous media: Kinetics and mechanisms.
Metall. Mater. Trans. B 1998,
29, 95–104. doi:10.1007/s11663-998-0011-4.
[Google Scholar]
-
20.
Testa JJ, Grela MA, Litter MI. Experimental Evidence in Favor of an Initial One-Electron-Transfer Process in the Heterogeneous Photocatalytic Reduction of Chromium(VI) over TiO
2.
Langmuir 2001,
17, 3515–3517. doi:10.1021/la010100y.
[Google Scholar]
-
21.
Testa JJ, Grela MA, Litter MI. Heterogeneous Photocatalytic Reduction of Chromium(VI) over TiO
2 Particles in the Presence of Oxalate: Involvement of Cr(V) Species.
Environ. Sci. Technol. 2004,
38, 1589–1594. doi:10.1021/es0346532.
[Google Scholar]
-
22.
Meichtry JM, Brusa M, Mailhot G, Grela MA, Litter MI. Heterogeneous photocatalysis of Cr(VI) in the presence of citric acid over TiO
2 particles: Relevance of Cr(V)–citrate complexes.
Appl. Catal. B 2007,
71, 101–107. doi:10.1016/j.apcatb.2006.09.002.
[Google Scholar]
-
23.
Ohtani B. Photocatalysis A to Z—What we know and what we do not know in a scientific sense.
J. Photochem. Photobiol. C Photochem. Rev. 2010,
11, 157–178. doi:10.1016/j.jphotochemrev.2011.02.001.
[Google Scholar]
-
24.
Kominami H, Murakami S, Kato J, Kera Y, Ohtani B. Correlation between Some Physical Properties of Titanium Dioxide Particles and Their Photocatalytic Activity for Some Probe Reactions in Aqueous Systems.
J. Phys. Chem. B 2002,
106, 10501–10507. doi:10.1021/jp0147224.
[Google Scholar]
-
25.
Liu W, Ni J, Yin X. Synergy of photocatalysis and adsorption for simultaneous removal of Cr(VI) and Cr(III) with TiO
2 and titanate nanotubes.
Water Res. 2014,
53, 12–25. doi:10.1016/j.watres.2013.12.043.
[Google Scholar]
-
26.
Meichtry JM, Colbeau-Justin C, Custo G, Litter MI. Preservation of the photocatalytic activity of TiO
2 by EDTA in the reductive transformation of Cr(VI). Studies by Time Resolved Microwave Conductivity.
Catal. Today 2014,
224, 236–243. doi:10.1016/j.cattod.2013.10.021.
[Google Scholar]
-
27.
Weng CH, Wang JH, Huang CP. Adsorption of Cr(VI) onto TiO
2 from dilute aqueous solutions.
Water Sci. Technol. 1997,
35, 55–62. doi:10.1016/S0273-1223(97)00114-5.
[Google Scholar]
-
28.
García Rodenas LA, Weisz AD, Magaz GE, Blesa MA. Effect of Light on the Electrokinetic Behavior of TiO
2 Particles in Contact with Cr(VI) Aqueous Solutions.
J. Colloid Interface Sci. 2000,
230, 181–185. doi:10.1006/jcis.2000.7053.
[Google Scholar]
-
29.
Di Iorio Y, San Román E, Litter MI, Grela MA. Photoinduced reactivity of strongly coupled TiO
2 ligands under visible irradiation. An examination of Alizarin Red@TiO
2 nanoparticulate system.
J. Phys. Chem. C 2008,
112, 16532–16538. doi:10.1021/jp8040742.
[Google Scholar]
-
30.
Meichtry JM, Dillert R, Bahnemann DW, Litter MI. Application of the stopped-flow technique to TiO
2-heterogeneous photocatalysis of hexavalent chromium in aqueous suspensions. Comparison with O
2 and H
2O
2 as electron acceptors.
Langmuir 2015,
31, 6229–6236. doi:10.1021/acs.langmuir.5b00574.
[Google Scholar]
-
31.
Kuncewicz J, Ząbek P, Kruczała K, Szaciłowski K, Macyk W. Photocatalysis Involving a Visible Light-Induced Hole Injection in a Chromate(VI)−TiO
2 System.
J. Phys. Chem. C 2012,
116, 21762–21770. doi:10.1021/jp3040715.
[Google Scholar]
-
32.
García González ML, Martinez Chaparro A, Salvador P. Photoelectrochemical study of the TiO
2-Cr system. Observation of strong(001) rutile photoetching in the presence of Cr(VI).
J. Photochem. Photobiol. A 1993,
73, 221–231. doi:10.1016/1010-6030(93)90009-a.
[Google Scholar]
-
33.
Meichtry JM, Colbeau-Justin C, Custo G, Litter MI. TiO
2-photocatalytic transformation of Cr(VI) in the presence of EDTA: comparison of different commercial photocatalysts and studies by Time Resolved Microwave Conductivity.
Appl. Catal. B 2014,
144, 189–195. doi:10.1016/j.apcatb.2013.06.032.
[Google Scholar]
-
34.
Montesinos VN, Salou C, Meichtry JM, Colbeau-Justin C, Litter MI. Role of Cr(III) deposition during the photocatalytic transformation of hexavalent chromium and citric acid over P25 and UV100.
Photochem. Photobiol. Sci. 2016,
15, 228–234. doi:10.1039/c5pp00420a.
[Google Scholar]
-
35.
Karunadasa KSP, Manoratne CH. Microstructural view of anatase to rutile phase transformation examined by
in-situ high-temperature X-ray powder diffraction.
J. Solid State Chem. 2022,
314, 123377. doi:10.1016/j.jssc.2022.123377.
[Google Scholar]
-
36.
Kosmulski M. The significance of the difference in the point of zero charge between rutile and anatase.
Adv. Colloid Interface Sci. 2002,
99, 255–264. doi:10.1016/S0001-8686(02)00080-5.
[Google Scholar]
-
37.
EPA. SW-846 Test Method 7196A: Chromium, Hexavalent (Colorimetric). 1992. Available online: https://www.epa.gov/sites/default/files/2015-12/documents/7196a.pdf (accessed on 9 July 2025).
-
38.
Wendlandt WW, Hecht HG. Reflectance Spectroscopy, 1st ed.; Wiley Interscience: New York, NY, USA, 1966; pp. 55–76.
-
39.
Xia L, Akiyama E, Frankel G, McCreery R. Storage and Release of Soluble Hexavalent Chromium from Chromate Conversion Coatings. Equilibrium Aspects of CrVI Concentration.
J. Electrochem. Soc. 2000,
147, 2556–2562. doi:10.1149/1.1393568.
[Google Scholar]
-
40.
Zuehlsdorff TJ, Isborn CM. Modeling absorption spectra of molecules in solution.
Int. J. Quantum Chem. 2019,
119, e25719. doi:10.1002/qua.25719.
[Google Scholar]
-
41.
Li C-W, Benjamin MM, Korshin GV. Characterization of NOM and its adsorption by iron oxide coated sand (IOCS) using UV and fluorescence spectroscopy.
J. Environ. Eng. Sci. 2006,
5, 467–472. doi:10.1139/s06-012.
[Google Scholar]
-
42.
Azizian S, Eris S, Wilson LD. Re-evaluation of the century-old Langmuir isotherm for modeling adsorption phenomena in solution.
Chem. Phys. 2018,
513, 99–104. doi:10.1016/j.chemphys.2018.06.022.
[Google Scholar]
-
43.
Adamczyk Z, Siwek B, Zembala M. Negative cooperativity in adsorption and adhesion of particles.
Biofouling 1991,
4, 89–98. doi:10.1080/08927019109378198.
[Google Scholar]
-
44.
Emilio CA, Litter MI, Kunst M, Bouchard M, Colbeau-Justin C. Phenol Photodegradation on Platinized-TiO
2 Photocatalysts Related to Charge-Carrier Dynamics.
Langmuir 2006,
22, 3606–3613. doi:10.1021/la051962s.
[Google Scholar]
-
45.
Cappelletti G, Bianchi CL, Ardizzone S. Nano-titania assisted photoreduction of Cr(VI). The role of the different TiO
2 polymorphs.
App. Catal. B 2008,
78, 193–201. doi:10.1016/j.apcatb.2007.09.022.
[Google Scholar]
-
46.
Irie H, Shibanuma T, Kamiya K, Miura S, Yokohama T, Hashimoto K. Characterization of Cr(III)-grafted TiO
2 for photocatalytic reaction under visible light.
Appl. Catal. B 2010,
96, 142–147. doi:10.1016/j.apcatb.2010.02.011.
[Google Scholar]
-
47.
Tel H, Altaş Y, Taner MS. Adsorption characteristics and separation of Cr(III) and Cr(VI) on hydrous titanium(IV) oxide.
J. Hazard. Mat. B 2004,
112, 225–231. doi:10.1016/j.jhazmat.2004.05.025.
[Google Scholar]
-
48.
Ku Y, Jung I-L. Photocatalytic Reduction of Cr(VI) in Aqueous Solutions by UV Irradiation with the Presence of Titanium Dioxide.
Water Res. 2001,
35, 135–142. doi:10.1016/S0043-1354(00)00098-1.
[Google Scholar]
-
49.
Debnath S, Ghosh UC. Kinetics, isotherm and thermodynamics for Cr(III) and Cr(VI) adsorption from aqueous solutions by crystalline hydrous titanium oxide.
J. Chem. Thermodyn. 2008,
40, 67–77. doi:10.1016/j.jct.2007.05.014.
[Google Scholar]
-
50.
Wu S, He X, Wang L, Chou K-C. High Cr(VI) adsorption capacity of Rutile titania prepared by hydrolysis of TiCl
4 with AlCl
3 addition.
Int. J. Miner. Metall. Mater. 2020,
27, 1157–1163. doi:10.1007/s12613-020-1965-8.
[Google Scholar]
-
51.
Yanagida S, Yajima T, Takei T, Kumada N. Removal of hexavalent chromium from water by Z-scheme photocatalysis using TiO
2 (rutile) nanorods loaded with Au core–Cu
2O shell particles.
J. Environ. Sci. 2022,
115, 173–189. doi:10.1016/j.jes.2021.05.025.
[Google Scholar]
-
52.
Xu S, Zhang Y, Wang S, Xu J, Ding H, Li G. Structure-Enhanced Photocatalytic Removal of CrVI by a TiO
2 Superstructure with Ultrathin Rutile Nanorods and Abundant {110} Faces.
Eur. J. Inorg. Chem. 2013,
2013, 2601–2607. doi:10.1002/ejic.201201475.
[Google Scholar]
-
53.
Lee G, Hering JG. Oxidative Dissolution of Chromium(III) Hydroxide at pH 9, 3, and 2 with Product Inhibition at pH 2.
Environ. Sci. Technol. 2005,
39, 4921–4928. doi:10.1021/es048073w.
[Google Scholar]
-
54.
Hinteregger E, Pribil AB, Hofer TS, Randolf BR, Weiss AKH, Rode BM. Structure and Dynamics of the Chromate Ion in Aqueous Solution. An ab Initio QMCF-MD Simulation.
Inorg. Chem. 2010,
49, 7964–7968. doi:10.1021/ic101001e.
[Google Scholar]
-
55.
Agrios AG, Gray KA, Weitz E. Photocatalytic Transformation of 2,4,5-Trichlorophenol on TiO
2 under Sub-Band-Gap Illumination.
Langmuir 2003,
19, 1402–1409. doi:10.1021/la026397x.
[Google Scholar]
-
56.
Rahman KA, Sharma N, Atanacio AJ, Bak T, Wachsman ED, Moffitt M, Nowotny J. Chromium segregation in Cr-doped TiO
2 (rutile): impact of oxygen activity.
Ionics 2019,
25, 3363–3372. doi:10.1007/s11581-018-2828-4.
[Google Scholar]
-
57.
Siemon U, Bahnemann D, Testa JJ, Rodríguez D, Litter MI, Bruno N. Heterogeneous photocatalytic reactions comparing TiO
2 and Pt/TiO
2.
J. Photochem. Photobiol. A 2002,
148, 247–255. doi:10.1016/S1010-6030(02)00050-3.
[Google Scholar]
-
58.
Scanlon DO, Dunnill CW, Buckeridge J, Shevlin SA, Logsdail AJ, Woodley SM, et al. Band alignment of rutile and anatase TiO
2.
Nat. Mater. 2013,
12, 798–801. doi:10.1038/nmat3697.
[Google Scholar]
-
59.
Miyoshi A, Nishioka S, Maeda K. Water Splitting on Rutile TiO
2-Based Photocatalysts.
Chem. Eur. J. 2018,
24, 18204–18219. doi:10.1002/chem.201800799.
[Google Scholar]
-
60.
Hwang JY, Moon G, Kim B, Tachikawa T, Majima T, Hong S, et al. Crystal phase-dependent generation of mobile OH radicals on TiO
2: Revisiting the photocatalytic oxidation mechanism of anatase and rutile.
Appl. Catal. B 2021,
286, 119905. doi:10.1016/j.apcatb.2021.119905.
[Google Scholar]
-
61.
Pettine M, Campanella L, Millero FJ. Reduction of hexavalent chromium by H
2O
2 in acidic solutions.
Environ. Sci. Technol. 2002,
36, 901–907. doi:10.1021/es010086b.
[Google Scholar]
-
62.
Pechishcheva NV, Ordinartsev DP, Valeeva AA, Zaitseva PV, Korobitsyna AD, Sushnikova AA, et al. Adsorption of Cr(VI) by Nanosized Rutile under the Action of UV Radiation.
Russ. J. Phys. Chem. A 2023,
97, 392–396. doi:10.1134/S0036024423020206.
[Google Scholar]
-
63.
Ball JW, Nordstrom DK. Critical Evaluation and Selection of Standard State Thermodynamic Properties for Chromium Metal and Its Aqueous Ions, Hydrolysis Species, Oxides, and Hydroxides.
J. Chem. Eng. Data 1998,
43, 895–918. doi:10.1021/je980080a.
[Google Scholar]
-
64.
Wang N, Gao Q, Li X, Li J, Lou X. Tris buffer-accelerated ligand exchange rate for instant fluorescence detection of trivalent chromium ion.
Anal. Chim. Acta 2024,
1302, 342509. doi:10.1016/j.aca.2024.342509.
[Google Scholar]
-
65.
Sprycha R, Jablonski J, Matijević E. Physicochemical characteristics of monodispersed chromium hydroxide particles.
Colloids Surf. 1992,
67, 101–107. doi:10.1016/0166-6622(92)80290-I.
[Google Scholar]
-
66.
Krumpolc M, Roček J. Stable Chromium(V) Compounds.
J. Am. Chem. Soc. 1976,
98, 872–873. doi:10.1021/ja00419a057.
[Google Scholar]
-
67.
Codd R, Lay PA, Levina A. Stability and Ligand Exchange Reactions of Chromium(IV) Carboxylato Complexes in Aqueous Solutions.
Inorg. Chem. 1997,
36, 5440–5448. doi:10.1021/ic970834r.
[Google Scholar]
-
68.
Emeline AV, Ryabchuk VK, Serpone N. Dogmas and Misconceptions in Heterogeneous Photocatalysis. Some Enlightened Reflections.
J. Phys. Chem. B 2005,
109, 18515–18521. doi:10.1021/jp0523367.
[Google Scholar]
-
69.
Zhang Z, Yates JT. Direct Observation of Surface-Mediated Electron-Hole Pair Recombination in TiO
2(110).
J. Phys. Chem. C 2010,
114, 3098–3101. doi:10.1021/jp910404e.
[Google Scholar]