3.1. The First Steps of Photo-Mass Spectrometry
A pressure change above the sample is a necessary but not sufficient indicator of photoinduced adsorption/desorption effects. Such pressure shift can be caused by photochemical reactions (for example, oxidation of adsorbed contaminants) in the system under study. Therefore, to prove the photosorption effect, it is necessary to show that the system under study (for example, O
2-ZnO, O
2-TiO
2) is truly binary,
i.e., it does not contain extraneous components. It is possible only if there is a reliable universal method to analyze the composition of both the gas mixture above the sample and the adsorbed layer. Replacing the integral pressure gauge with a mass spectrometer [
10] allowed one to solve fundamentally new problems: besides a quantitative analysis of the gas mixture, study the gas phase composition above the adsorbent.
In the preliminary experiments [
11], the primary products of the photo-desorption were studied. For this purpose, the sample was placed in the chamber of a time-of-flight mass spectrometer at a distance of 30 mm from the ion source in a vacuum of 2 × 10
−8 Torr and was illuminated with short 10
−6 sec light pulses. Photo-desorbed particles entered the ion source “on a straight run” without collisions with other particles or the device walls. In this way, primary “hot” molecules and radicals were registered.
Dispersed ZnO was studied. The illumination of the sample after oxygen adsorption led to photo-desorption of multiple products such as H
2O, OH, CO, and CO
2, but the molecular oxygen content did not exceed several percent, indicating the sample contamination with residual vacuum molecules. Attempts to obtain and maintain a clean surface for studying photo-activated oxygen reactions were unsuccessful. However, it was possible, in particular, to observe OH radicals photo-desorption after H
2O adsorption.
In order to work with a thoroughly cleaned sample, another setup was designed [
12]. The dispersed sample was deposited as a thin layer in water bidistillate to the quartz reactor walls. After pumping down to 10
−8 Torr, the sample was heated at 800 K in a flow of pure (99.99) oxygen at 10
−1 Torr for tens of hours until the complete disappearance of CO and CO
2 traces in the evacuated gas. The analysis was performed with a magnetic mass spectrometer. The TDS (thermo-desorption spectroscopy) analysis of the adsorbed phase composition revealed the contaminants at the level of 10
−5 monolayers.
This installation enabled the study of photoadsorption and photodesorption in the O
2-ZnO system with an impurity content in the gas phase lower than 0.1%. The use of the
18O isotope revealed the dynamic nature of photosorption processes: manometrically observed pressure changes above the sample are the sum of coexisting photoadsorption from the gas phase and photo-desorption from the sample.
These experiments pioneered research in photo-activated isotope exchange of oxygen over oxide photocatalysts.
It is obvious that for understanding the mechanism of the photons influence on such systems, a comprehensive analysis of photo-adsorption, photodesorption, and photo-activated processes in the gas and adsorbed phases is required. Consequently, a new generation experimental setup should provide precise control over experimental conditions, allow for investigation processes involving multicomponent mixtures, and analyze the reaction kinetics for each component; using stable isotopes, separate competing terms of the photoactivated process in a binary system (for example, photo-adsorption and photo-desorption).
3.2. Experimental Technique
Extensive photo-manometric studies have demonstrated that inconsistent and irreproducible experimental results were caused by insufficient sample characterization and experimental purity. Therefore, special attention was paid to address these shortcomings. The XPS, X-ray diffraction (XRD), and scanning electron microscopy (SEM) methods were used to characterize the samples before and after the experiments. However, the sensitivity of these methods does not exceed 10
−3 monolayers, while the number of active centers in self-sensitized oxides does not exceed 10
−5 monolayers.
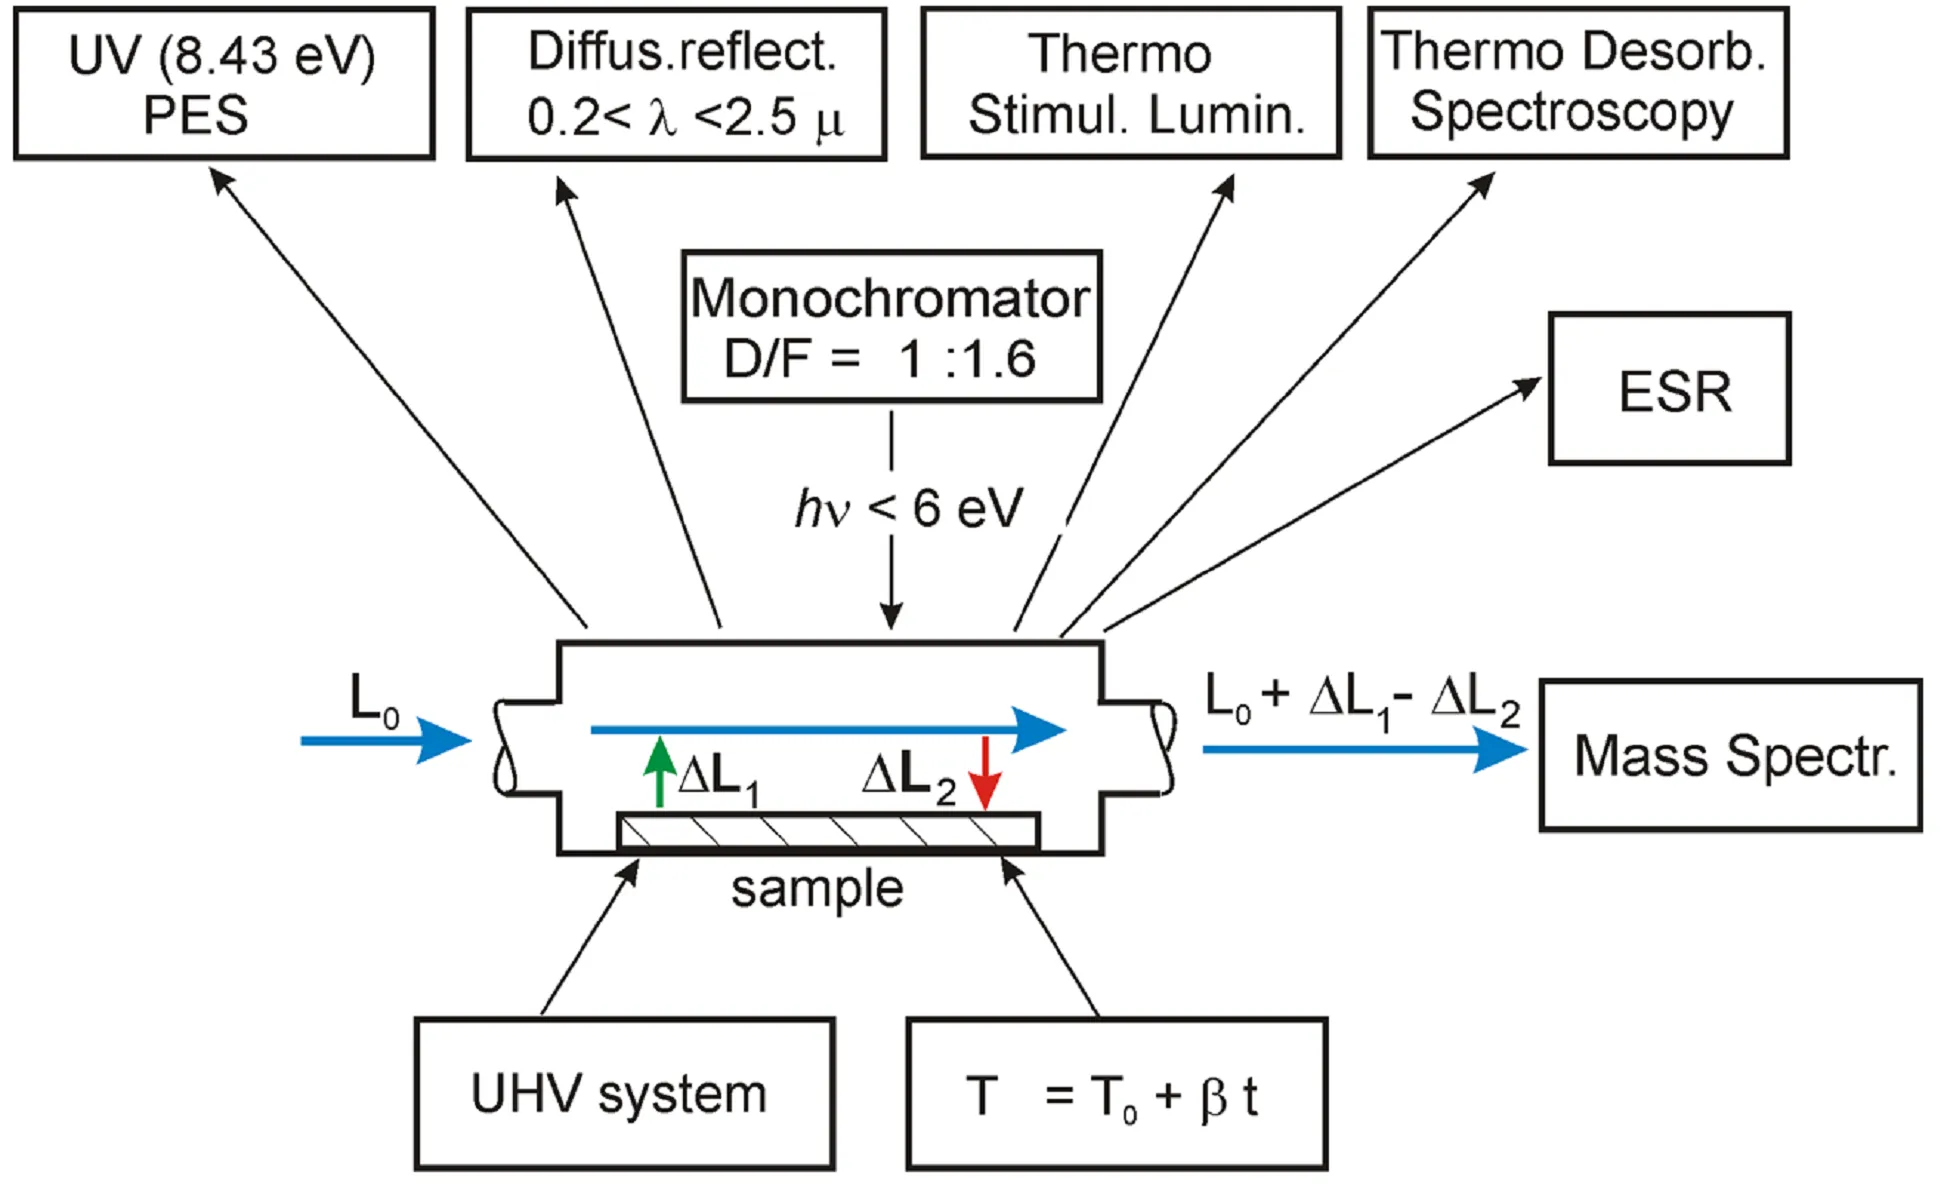
The following methods (see ): mass-spectrometry, UV (8.43 eV) photoelectron spectroscopy (PES), optical (diffusion reflectance) spectroscopy (DRS), TDS, spectra of excitation and emission of thermoactivated luminescence (TSL), and electron spin resonance spectroscopy (ESR) have been adapted for in situ investigations in three phases: gas, adsorbate and solid state [
13,
14,
15]. The reaction block was made of quartz and stainless steel, without lubricants, taking into account the requirements for UHV installations.
Dispersed powders of nominally pure oxides were deposited on the lower wall of a quartz reactor (V = 65 cm
3) from the suspension in bidistilled water and preliminary purified by heating in oxygen (99.99%) flow at the pressure of 0.5 Torr for 10–20 h at 870 K in order to remove the biographic pollutants. The criterion of the sample purity was the absence of CO and CO
2 in the output oxygen flow registered by the mass spectrometer. The “reduced” samples were obtained by heating in ultrahigh vacuum (better than 10
−8 Torr), and the “oxidized” samples were obtained by annealing in oxygen (99.99%). All measurements were performed at 290 K except for specially marked cases.
. Experimental setup for in situ diagnostics and photocatalytic experiments. L<sub>0</sub> is the initial gaz flow, ΔL<sub>1</sub> the gaz flow from the sample due to photodesorption, ΔL<sub>2</sub> the gaz flow onto the sample due to photoadsorption.
UV (8.43 eV) PES is the photoelectron spectrometer with the Xe resonance source [
14], Diff.reflect. 200 < λ < 2500 nm is the spectrophotometer for the UV-VIS-NIR range [
15], Thermo Stimul.Lumin. is the spectrometer for the analysis of thermoactivated luminescence excitation and emission spectra. Thermo Desorb. Spectroscopy is realized in “flow-through” regime. Monochromator is of original construction with aperture 1:1.6 for a spectral range of 200 < λ < 800 nm [
13], ESR is the electron spin resonance spectrometer [
16]; Mass Spectr. is the mass-spectrometer; UHV system is the Ultra High Vacuum system. T = T
0 + βt is the system for variation of the sample temperature with a constant rate 0.1 < β < 0.5 K/s in the range of 300 < T < 1000 K for TDS and TSL measurements. L
0 is the initial gas flow, ΔL
1 is the gas flow from the sample due to photodesorption, ΔL
2 is the gas flow onto the sample due to photoadsorption. The original UV (8.43 eV) photoelectron spectrometer [
13] is specialized for the in situ studies of extremely low concentrations of filled electronic states in the bandgap.
Special attention was paid to obtaining and maintaining a clean surface of the sample [
17]. The quality of cleaning the oxide surfaces was controlled using TDS spectra.
In the quasi-stationary mode (L
0 = 0), the actual sensitivity for recording the process speed
dn/dt of about (10
−7−10
−8) Torr/s is given by the expression $$-\frac{dn}{dt}\approx\frac{1}{A}\frac{\Delta N}{t_p}$$ where Δ
N is the change in the number of molecules caused by illumination,
tp being the characteristic pump-off time of a mass-spectrometer (m-s). A typical pressure sensitivity in photo-manometric experiments in a closed volume of 20–50 cm
3 was ≥10
−5 Torr/s at the initial pressure of ~10
−2 Torr.
3.3. Flow-through m-s Method
The next step was the development of a flow-through m-s method for studying photo processes [
13]. In a quasi-stationary mode, gas sampling for mass analysis led to a drop in pressure in the reactor and thus limited the range of working pressures available for analysis. However, in a flow-through reactor, the gas sampling with a mass spectrometer is compensated for by an additional influx. Thus, the lower pressure limit, which is 10
−3 Torr for a quasi-stationary reactor, is reduced to 10
−6 Torr.
In a flow-through reactor () containing an adsorbent with a gas phase above it, the changes in concentration of the adsorbed phase
dn/dt mol·cm
2·s
−1 lead to changes in the gas phase $$-\frac{dn}{dt}=\frac{1}{A}\left(\frac{d\Delta N}{dt}\right)+\frac{\Delta N}{t_{_p}}$$.
The actual sensitivity for measuring the process rate in flow-through mode reaches 10
−10 Torr/s or 10
9 mol/s. This enhanced sensitivity allows one to avoid spherical and cylindrical reactors (black body-like) [
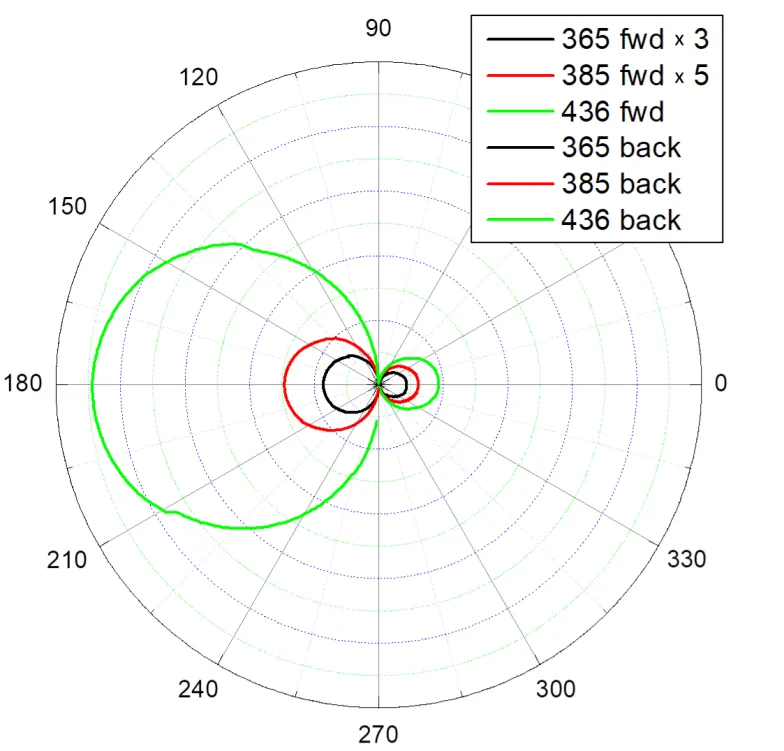
14] and use flat reactors, allowing one to connect additional in situ devices. The sample thickness is optimized based on forward and backward scattering indicatrix analysis. As an example, shows the measurement results of the “Degussa” TiO
2 sample.
. Scattering diagrams of the exciting beam radiation incident normally on the “Degussa” TiO<sub>2</sub> photocatalyst.
shows Scattering diagrams of the exciting beam radiation incident normally on the “Degussa” TiO
2 photocatalyst. The curves, close in shape to circles, join the ends of the radius vectors, characterizing the scattering amplitudes of a light beam at a given angle in the horizontal plane. The differences in the diameters of the circles reflect the spectral characteristics of the scattering. In the diagram, the light is incident from the left, so the intensity of backward scattering is greater than that of forward scattering after passing the sample. Similar measurements are taken in the vertical plane. As a result, three-dimensional figures close to spheres are obtained. They give the integrated intensities of light scattered into the front and rear hemispheres.
The difference between the intensity of incident and total scattered light allows one to obtain the number of light quanta absorbed by the sample. This procedure allows us to obtain quantitative characteristics of photoactivated processes without resorting to the geometry of a “black body” [
14]. In a “black body” geometry, the sample is placed inside a sphere and is accessible only for manometric measurements. We used a flat reactor that allowed for the first time
quantitative photo-mass spectrometric studies to be combined in situ with a range of complementary methods ().
Data processing using the Kubelka-Munk model for the layer thickness of 2.5 mg/cm
2 yielded the following flux values passing through the layer: 0.2 for λ = 436; 0.026 for λ = 385 and 0.0024 for λ = 365 nm, respectively. The data obtained allow one to optimize the choice of the sample thickness in photocatalytic experiments and to avoid a thick, non-illuminated sample layer.
Obviously, comprehensive information about multi-stage photo processing can be obtained only by total quantitative studies of the processes in the gas phase, on the surface, and in the bulk of the sample. The experimental complex shown in is designed for this purpose.
3.4. Spectro-Kinetic Investigation of Photosorption Processes in Flow-through Reactor
3.4.1. Gas-Phase
In the experiments, a pure (99.99%) oxygen flow was admitted over the carefully cleaned sample under the controllable dynamical pressure of 10
−8–10
−3 Torr. The sample was irradiated with a monochromatic light tuned in the spectral range of 200 < λ < 600 nm (6 >
hν > 2 eV) with a power density of ~1 × 10
−3–1 × 10
−1 W/cm
2 [
18].
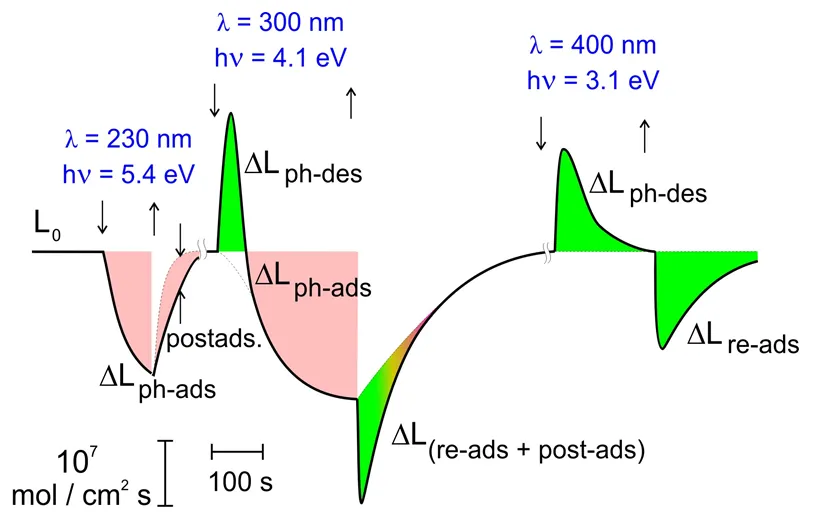
A high sensitivity of the “flow-through” regime (sensitivity for the photo-desorption detection from powders which reached 10
−7 monolayer/s), exceeding the photo-manometric method sensitivity by 3–4 orders of magnitude, enables novel avenues for investigating photosorption processes. It allows the determination of spectral characteristics of photo-processes using monochromatic radiation for excitation. An example of determining kinetic parameters in the O
2-Al
2O
3 system is given in .
In order to determine the quantum yield of a reaction, the numbers of quanta incident on the sample, reflected from the sample and having passed through the sample, were measured using the spectro-goniometer ().
. Effect of illumination on the change of O<sub>2</sub> flow over Al<sub>2</sub>O<sub>3</sub>.
The quantum yield for photoadsorption Ф
pa or photodesorption Ф
pd is $$\Phi=\frac{dn}{dt}\frac{1}{k_\lambda I_{h\nu}}$$ where k
λ is the absorption coefficient of the sample, and I
hν is the light intensity. A system [O
2–Al
2O
3] is shown in .
The illumination shifts sharply the initial dynamical gas-surface equilibrium [
19]. The sign of ΔL depends on the spectral region of the light. So, for O
2–Al
2O
3 system in the high-energy spectral region (
hv > 4 eV), the irreversible photo-adsorption is observed. The opposite effect—a reversible photo-desorption—is observed in the low-energy region (
hv < 3 eV). In the middle-energy region, both effects coexist. Both effects are spectrally selective and site- sensitive.
For a number of studied oxides, the kinetic parameters of active centers varied in a wide range:
10
−5 < τ < 10
3 s, 10
−17 < σ < 10
−16 cm
2, 10
−6 < Ф
pa < 10
−4 molec/quantum, 10
−5 < Ф
pd < 10
−4.
The first step of photoactivation in the sub-bandgap region is the photoexcitation of local F-type and V-type centers. The spectral maximum of photo-adsorption efficiency on Al
2O
3 is centered at ~230 nm, and has a shoulder at ~260 nm that coincides with the optical absorption of F
+-centers [
18].
The spectral efficiencies of oxygen photodesorption and CO photo-adsorption are shifted to a long-wavelength region in the absorption band of V-centers [
18]. So O
2 photodesorption is activated by a photoexcitation of hole V-type centers (not of electron F-type centers).
The spectral efficiency of preliminary irradiation in UHV (the “memory effect”) matches the spectral band of photo-adsorption efficiency, suggesting the same nature of short-lived and long-lived centers.
The obtained results lead to the following conclusions.
The quantum, nonthermic photon-driven adsorption, and desorption are proven to exist for all studied oxides. These processes are site-sensitive and spectrally selective. The kinetic model of the interaction of gas (photo-adsorption) or adsorbed (photo-desorption) molecules with photo-generated local centers is justified. The F-type and V-type centers appear to be responsible for the primary act of photon adsorption/desorption (see and ). Similar results were obtained for oxygen photo-adsorbed on wide-bandgap oxides (BeO, MgO) [
20,
21] and on other oxides (ZnO and TiO
2) [
22,
23]. The recombination of photo-generated centres, as well as the adsorption of molecules on these centres are the pathways of photo-excited surface relaxation.
.
Energy excitation of photoactive centers.
|
BeO |
Al2O3 |
MgO |
ZnO |
TiO2 |
| Eg |
10.5 |
9.3 |
7.8 |
3.4 |
3.2 (3.0) |
| Фpa max |
6.6 |
5.5 |
5.1 |
3.1, 2.4 |
|
| Фpd max |
3.5 |
3.2 |
|
3.1 |
|
| hνmax abs of centers |
6.6, 5.4, 3.4
F, F+, V
|
5.4, 3.1
F+, V−
|
5.0, 2.3–1.8
F, F+, V−
|
3.1, 2.4
F+, F, (V)
|
F, F+ |
.
Color centers and photoactivation channels.
| Color Centers |
F-type centers—oxygen vacancy:
empty (F++); with 1 (F+) or 2 electrons (F)
|
V-type centers—cation vacancy:
empty (V−−), with 1 (V−) or 2 (V0) holes
|
| Photoexcitation Channels |
| F(2e) + hv1 → F+(e) + e |
V0 + hv3 → V− + h + hv” |
| F+ + hv2 → F++ + e |
| F+ + hv3 → F(2e) + V– |
| F + V− → V0 + hv’ |
3.4.2. Structure of Photoadsorbed Oxygen
The structural diversity of photoactivated centers should result in different configurations of molecule adsorption. To verify this hypothesis, the oxygen adsorption configurations on illuminated Al
2O
3 were studied [
19].
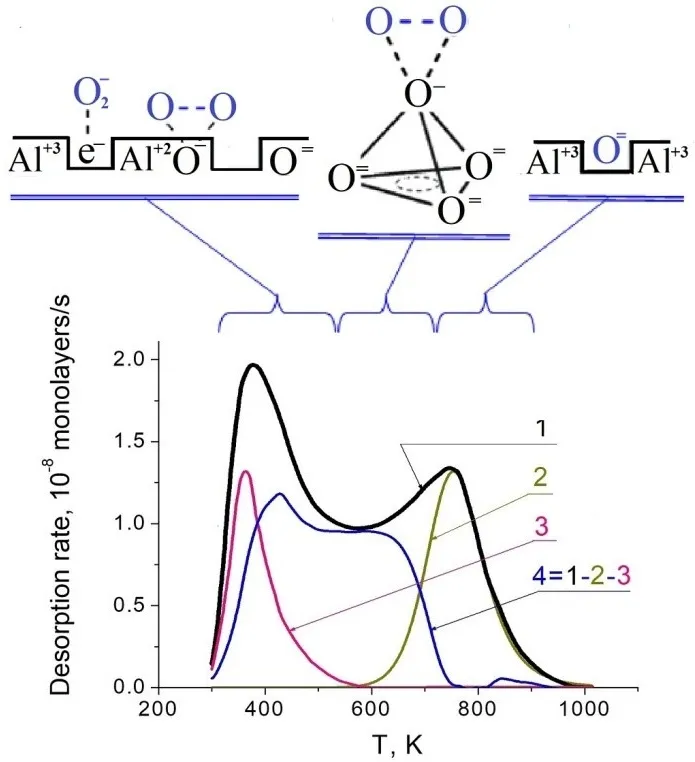
A combined analysis of TD spectra, thermo-programmed bleaching of optical absorption, TSL, ESR, and isotopic exchange have revealed three oxygen species A, B, C on photoactivated Al
2O
3 surface ().
-
-
Species A: a molecular peak at 380 K,
-
-
Species B: a photoadsorbed O atom in an on-top site above a surface metal vacancy,
-
-
Species C: oxygen atoms, filling anion vacancies.
Thus, the formation of species C on the UV-irradiated surface allows the healing of the surface defects of F-type. The species B and C are typical for only UV-irradiated samples. Very similar results were obtained on the oxygen species photoadsorbed on other wide-bandgap oxides.
. TD spectra of O<sub>2</sub> species adsorbed on illuminated Al<sub>2</sub>O<sub>3</sub>.
The low-temperature peak at 380 K in the TD spectra corresponds to the molecular species A. Here, the molecule-surface bond is weak, and E
des does not exceed 1 eV. The bond is provided by the charge transfer between an oxygen molecule and surface centers of F
S and/or V
S-type, thus producing O
2 (a) and [O
2 ··· O
S] (b) complexes. It results in the emergence of the absorption band of F
+ centers at 5.4 eV and of the ESR signal with
g = 2.012 ± 0.001. Such a signal indicates a charge transfer between the adsorbed oxygen molecule and the V
S center.
Another species B, has a stronger bond between the oxygen and the surface characterized by
Edes = 1.2–1.8 eV. It decays in the intermediate temperature range of 450 ≤ T ≤ 600 K, just where V-type centers are decomposed. This species gives the UV absorption band at 3.1 eV and also the ESR signal characterized by two parameters:
g┴ = 2.0355 ± 0.0005 and
g║ = 2.0028 ± 0.0005. Such ESR signal is typical for a tetrahedral symmetry center. Its thermo-bleaching peak is close to the TSL peak at T
max = 530 K and to the thermo-bleaching peak of the optical absorption band at 2.9 eV. So, we suggest that all three parameters characterize the same center. Its decay in the temperature range of 450–600 K causes the desorption of oxygen molecules. The photo-adsorbed oxygen atom is placed in an on-top site above the surface metal vacancy, which has four surface anions on the basis of the double tetrahedron. The complex is stabilized by a hole captured by one of the basis anions. The hole delocalization results in the decay of the center.
The species C (
Edes reaching 4 eV) gives neither absorption band in the UV-VIS region (
hν < 6 eV), nor any ESR signal. The
Edes value is close to that of the thermolysis energy of the surface. This species has been attributed to oxygen atoms filling the anion vacancies. Thus, the formation of species C on the UV irradiated surface allows to heal the surface defects of F-type and, in this way, changes the surface stoichiometry and geometry even at temperatures insufficient to activate bulk atoms.
A broad variety of photon-driven effects enables the oxide surface creation without altering bulk properties. Thus, oxygen photoadsorption allows to achieve extremely low oxygen vacancy concentrations below 10
−6 monolayer. Our results demonstrate that oxide photoactivation within the
visible light absorption region activates both electron-donating centers and hole centers essential for redox reactions.
The oxygen isotope exchange model reaction enables the evaluation of the real possibility of their use.
3.4.3. POIE on ZnO Investigated with Flow-through m-s Method
The actual sensitivity for measuring the process rate in flow-through mode reaches 10
−10 Torr/s or 10
9 mol/s.
It has been previously shown that the analysis of the kinetics of thermally activated isotopic exchange of oxygen
18O of the gas phase with the catalyst can be used to predict the activity of oxide catalysts in dark oxidation reactions [
15,
24,
25].
In 1965, the isotope
18O was used to study the elementary stages of photosorption processes in the O
2-ZnO system [
2]. Having studied concentration changes in the mixture of isotopes
16O
2,
16O
18O and
18O
2, the authors concluded that the manometrically observed effects of pressure changes above the illuminated sample (photo-adsorption or photo-desorption) are complex dynamic processes of coexisting adsorption and desorption in the gas-solid system. These processes lead to an isotope content change both in the gas and solid. Subsequent experiments enabled to establish correlations between the activity of photoactivated isotope exchange of oxygen and the efficiency of the oxide photocatalyst in oxidation-reduction reactions.
The parameters of the isotope oxygen mixture are as follows:
- (1)
-
$$\alpha=\frac{C_{34}}{2}+C_{36}$$, being the 18O fraction in the mixture, and
- (2)
-
$$Y{=}2\alpha(1{-}\alpha){-}\mathrm{C}_{34}$$ giving the deviation from the equilibrium value, where C32, C34, C36 are the fractions of 16O2, 16O18O and 18O2, respectively. The mixture with Y ≠ 0 is called “non-equilibrated”.
Two types of oxygen exchange in any oxygen-oxide system can occur:
- 1.
-
homoexchange (homomolecular oxygen isotope equilibration POIEq) without the participation of surface atoms; in this case, Y → 0, αgas remains constant;
- 2.
-
heteroexchange POIEx with the participation of surface atoms; Y changes, αgas decreases if the catalyst has a natural isotopic composition.
Thus, during the POIE, two channels are photo-activated: homo- and hetero-molecular exchanges. The first one simulates the oxidation stages, and the second one is the reduction stages of the oxidation-reduction reaction. The study of a number of wide-band oxides showed the universality of the correlation found.
ZnO is the most active (along with TiO
2) photocatalyst for redox reactions due to the features of the electronic structure of ZnO, such as a large band gap (3.37 eV at 300 K), an electron affinity of ~4.0 eV, and a high carrier mobility (200 cm
2/V·s at 300 K). In the UV irradiated ZnO, the
e−/
h+ pairs have one of the highest redox potentials among the photocatalysts and can be used in photochemical cells for water decomposition and decontamination of the environment from a wide range of organic and inorganic pollutants. However, this efficiency is small and revealed only in the intrinsic absorption region
hν < 3.37 eV.
The main obstacle in achieving a high photoinduced efficiency upon UV activation semiconductor is the
e−/
h+ pair decay when moving from bulk to surface centers of photocatalysis due to the recombination with each other and with the recombination centers. A.N. Terenin pointed out that these losses can be avoided by using excitons to transfer the excitation energy [
26]. The exceptionally high exciton binding energy in ZnO (60 meV) ensures the stability of the
e−/
h+ pairs during their transfer at room temperature (
kT = 27 meV). However, this idea required decades of experimental investigation to be put into practice. In this paper, we give the results of these studies.
The activity of excitons in photocatalysis on ZnO was experimentally confirmed in 1990 [
27]. The exciton excitation maximum for the POIE reaction on ZnO has been discovered. However, the observed effect was lower than that under the excitation in the interband transitions region. It was found that the main intensity losses were caused by a radiative decay of the exciton on the surface, and the internal energy dissipates in the form of the exciton photoluminescence (PL) with a nearly 100% efficiency.
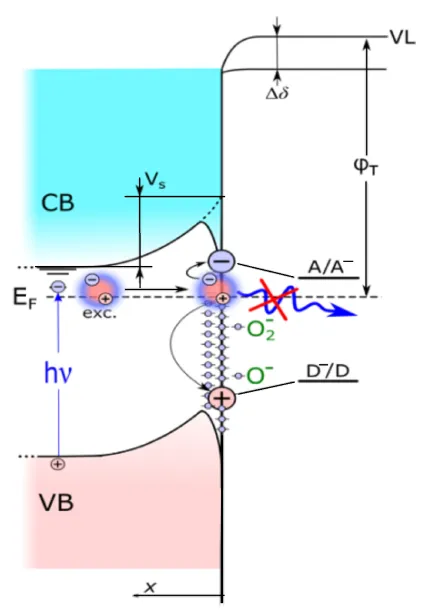
In Terenin’s laboratory, the problem of dissipation of exciton energy not into a photoluminescence quantum but into the generation of active centers of catalysis was solved by creating a surface layered nanostructure ZnO/ZnO
1−x/O
− [
28]. ZnO/ZnO
1−x is a 2D structure “core-shell” and O
− is the adsorbed atomic oxygen capturing an electron, thus forming a locking barrier over the “core-shell” structure. A high field strength inside the well leads to a dissociative polarization of the exciton, causing its nonradiative decay (). As a result, a “dead zone” for the exciton is created in the surface subatomic region of ZnO
1−x/O
−. The exciton decays and a free electron and a hole are localized on F- and V-type defects of the ZnO
1−x surface layer (see ). A comprehensive description of the nanostructure and its mechanism of action is given in [
28,
29,
30].
The energy of the absorbed light was retained for up to 8 × 10
3 s, which is typical for F- and V-type centers. It is these centers that sensitize the photocatalytic activity of reduced ZnO
1−x samples [
31,
32].
. Radiationless decay of exciton into a pair of long-lived centers in the 2D structure ZnO/ZnO<sub>1−x</sub>/$$\mathrm{O}^{-}$$. VB—valence band, CB—conduction band, E<sub>F</sub>—Fermi level, VL—vacuum levels before and after oxygen desorption, Δδ—dipole component, φ<sub>T</sub>—thermoelectric work function, V<sub>S</sub>—band bending of the original “oxidized” sample, A/A<em><sup>−</sup>, </em>D/D<em><sup>+</sup>—</em>acceptor and donor reagent levels.
The 2D structure ZnO/ZnO
1−x/O
− was formed using ZnO wurtzite structure consisting of 20–500 nm nanocrystallites [
9]. The samples were characterized using optical and photo-luminescence spectroscopy (PL), TSL in the ultraviolet (UV) and visible (VIS) light, SEM, UPS (21.4, 8.43 eV), and XRD. UPS (8.43 eV) allowed one to determine in situ the φ
T of the sample and to separate the contributions of the dipole component δ from the band bending V
S.
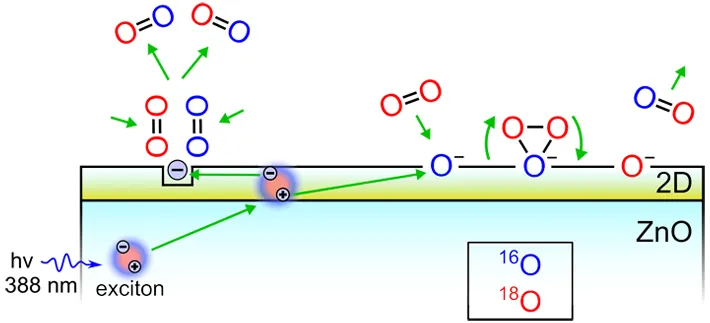
. POIE diagram on the ZnO/ZnO<sub>1−x</sub>/$$\mathrm{O}^{-}$$ structure under exciton excitation.
3.4.4. Modeling of the Kinetics of POIE O
2 ⇄ ZnO/ZnO
1−x/O
−
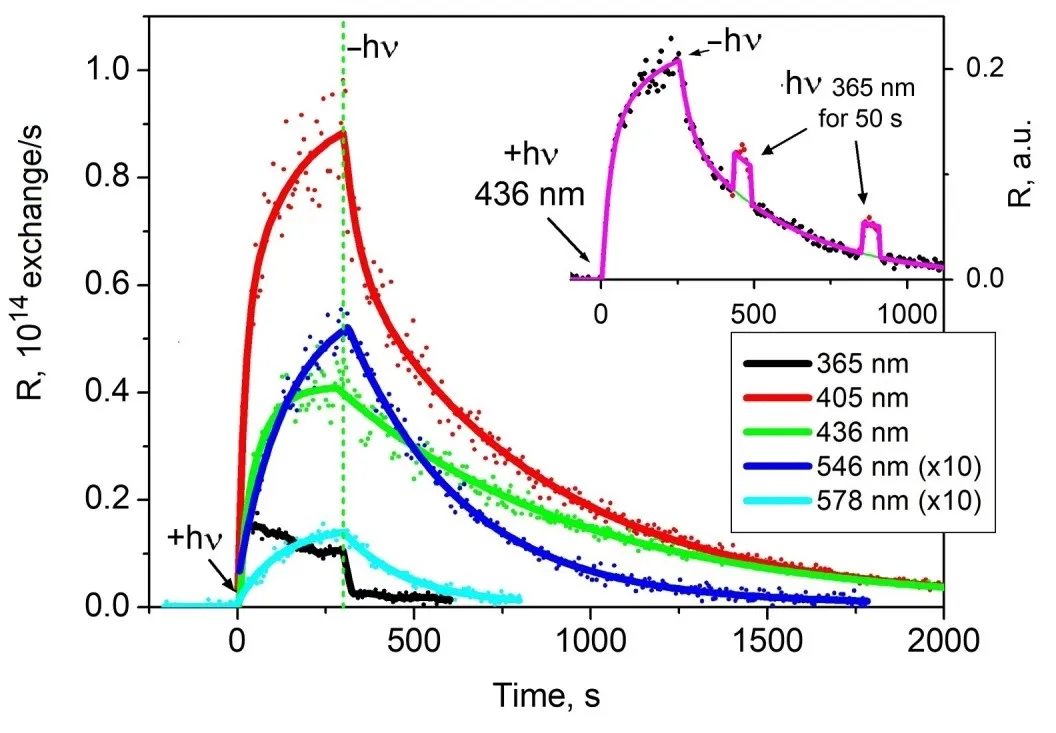
clearly illustrates the superiority of exciton excitation compared to interband excitation. The underlying process can be described mathematically using a vector-like equation, as detailed in reference [
31].
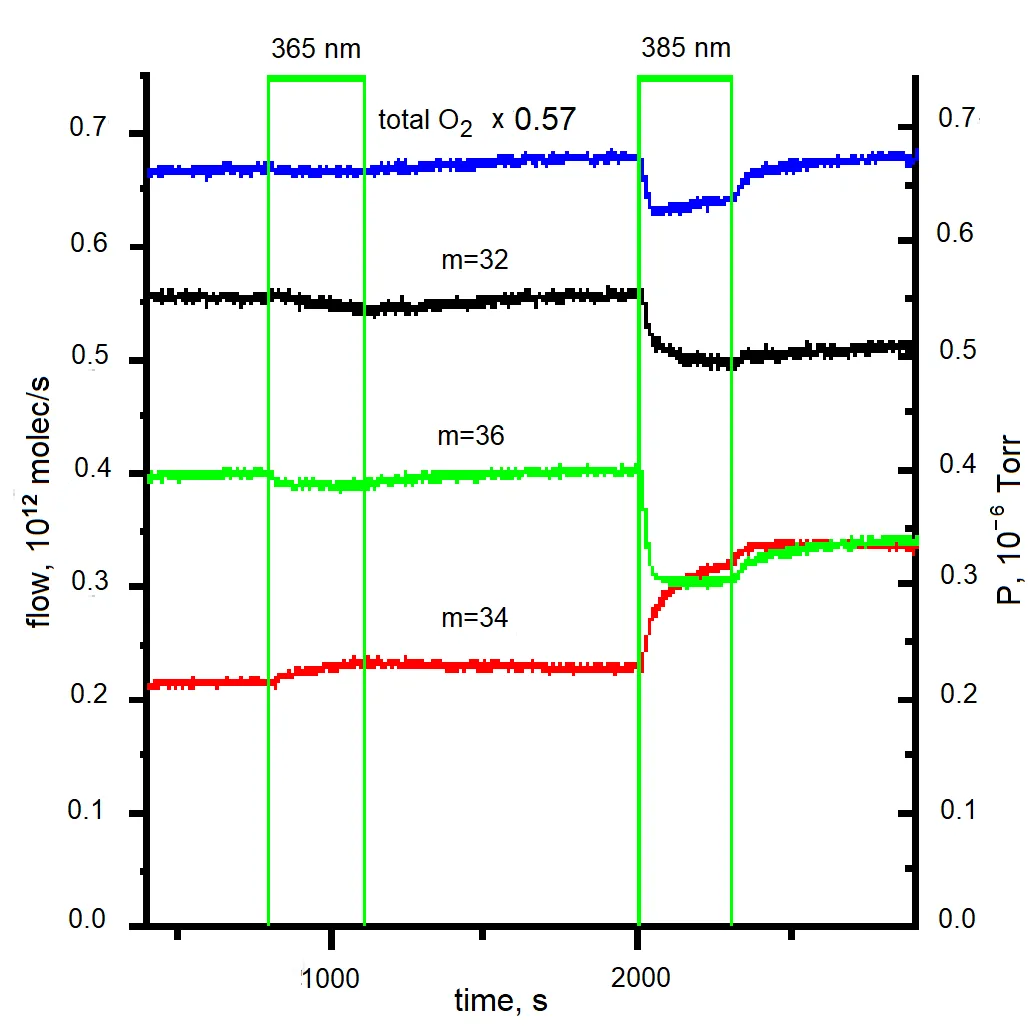
Figure 7. Effect of interband and exciton irradiation of the sample on the isotopic composition of the gas phase over the sample. The absorbed irradiation power for λ = 365 nm and λ = 385 nm is (10 ± 2) mW, P = 1.2 × 10<sup>−6</sup> Torr.
The radiative decay of an exciton is suppressed in the 2D structure ZnO/ZnO
1−x/O
−, where the exciton nonradiative decays into a pair of long-lived (up to 8 × 10
3 seconds) electron and hole localized states that facilitate chemical reactions. In this context, the notations in the governing equation are as follows: the components of the vector $$\vec{N}$$ represent the number of O
2 isotope molecules in the reactor with masses 32, 34, and 36 atomic mass units. The module of this vector is defined as the sum of its components,
i.e.,
The parameter α is defined by the ratio of isotope molecules in the gas phase $$\alpha = \frac{N_{36} + 0 . 5 \cdot N_{34}}{\left|\overset{\rightarrow}{N}\right|}$$and indicates the fraction of a specific isotope, while $$\overset{-}{\alpha} \equiv \left(1 - \alpha\right)$$ represents the fraction of
16O. The rate of homo-exchange, denoted as $$R_{x}$$, is measured in molecules per second ([molec/s]), and the rate of hetero-exchange, $$R_{q}$$, is measured in atoms per second ([atoms/s]).
The outflow rate, $$\overset{\rightarrow}{F}_{o u t} = \frac{\overset{\rightarrow}{N}}{\tau_{p u m p}}$$, corresponds to the number of molecules captured by mass spectrometry during the reactor’s pump-down time constant ([molec/s]), and $$\overset{\rightarrow}{F}_{i n}$$ is the inflow rate set during the experiment ([molec/s]). All these values ($$\overset{\rightarrow}{N}$$,$$R_{x}$$, $$R_{q}$$, $$\overset{\rightarrow}{F}_{o u t}$$, $$\overset{\rightarrow}{F}_{i n}$$, and RPA) depend on time.
In
Equation (1), the first two terms on the right side, $$\overset{\rightarrow}{F}_{i n} - \overset{\rightarrow}{F}_{o u t}$$, describe the flow regime. The third term, $$- R_{P A} \frac{\overset{\rightarrow}{N}}{\left|\overset{\rightarrow}{N}\right|}$$, represents “photo-adsorption,” while the fourth one, $$\overset{\rightarrow}{R}_{P D}$$, corresponds to “photo-desorption.” The fifth term accounts for “hetero-molecular exchange,” and the sixth term describes “homo-molecular exchange.” Although this differential equation is nonlinear, because all variables under differentiation are known functions of time, it can be transformed into an algebraic form.
In our experimental conditions, photo-desorption was not observed; therefore, it is considered to be zero in this analysis.
The notation
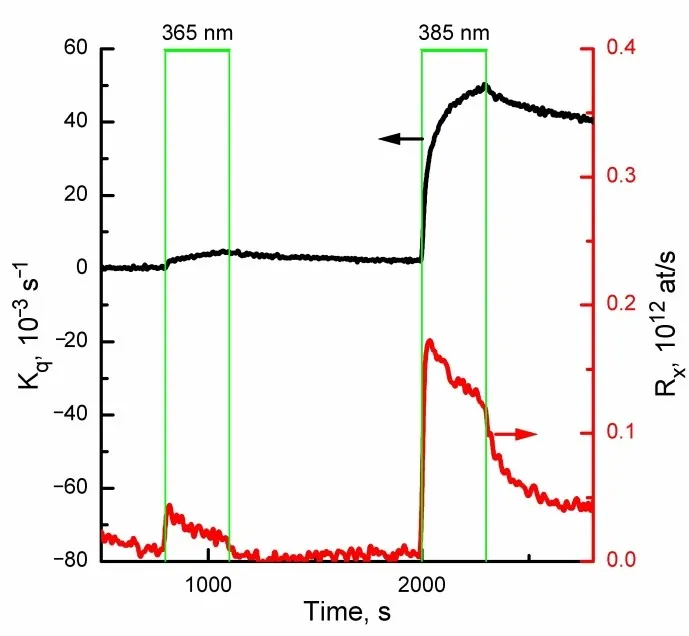
The results obtained for $$R_{q}$$ and $$R_{x}$$ are shown in
.
. Rates of $$k_{q}$$ <em>= Rq</em>/<em>N </em>и $$R_{x}$$ over ZnO/ZnO1−x/$$\mathrm{O}^{-}$$ under irradiation in the region of interband absorption at λ = 365 nm and exciton absorption at λ<sub>max</sub> = 385 nm.
The incident photon flux was approximately 1.8 × 10
16 quanta per second (±20%), with a pressure of P = 1.2 × 10
−6 Torr. It was observed that, for the POIE test reaction, irradiation within the exciton absorption band is about 5 to 8 times more effective than irradiation in the interband absorption region.
This example demonstrates that the efficiency of the 2D ZnO/ZnO
1−x/O
− structure activated near the resonant exciton excitation is approximately 5–8 times higher than when excited in the interband absorption region [
30].
4.1. Photocatalytic Reduction of NO by CO on ZnO1−x
To validate the predicted photocatalytic activity of ZnO
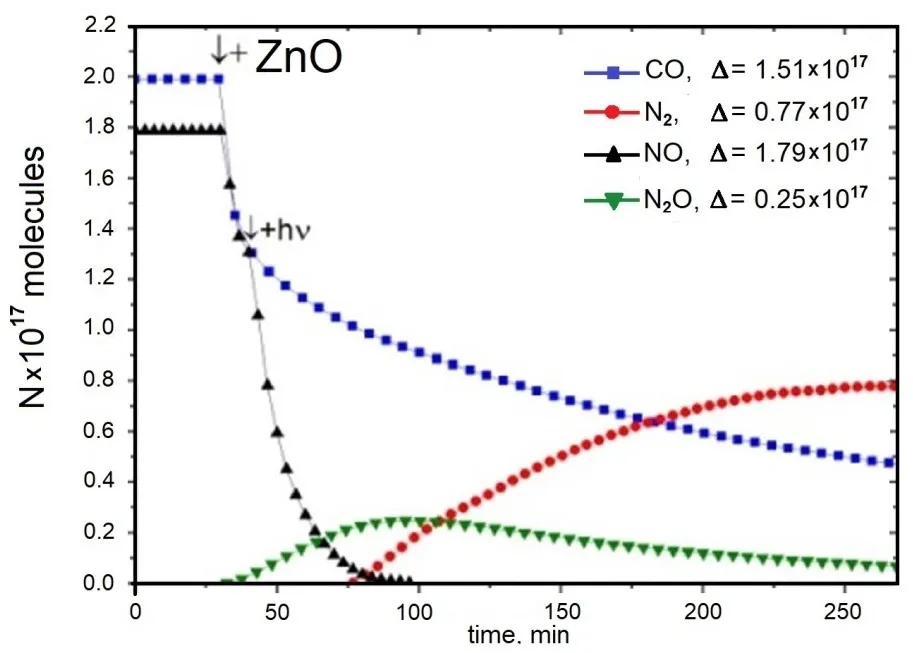
1−x within the visible light absorption range, the feasibility of performing an environmentally significant redox reaction $$\mathrm{CO}+\mathrm{NO}\overset{\mathrm{hv}}{{\to}}1/2\mathrm{N}_2\uparrow+\mathrm{CO}_{2_{\mathrm{ads}}}$$ (1) was examined [
32].
To understand the active sites and elucidate the reaction mechanism, several key characteristics were investigated: the photoactivation spectra, specific kinetic parameters, intermediate species, and final reaction products. The samples were characterized using a suite of techniques, including X-ray diffraction (XRD), X-ray photoelectron spectroscopy (XPS), ultraviolet photoelectron spectroscopy (UPS), Brunauer-Emmett-Teller (BET) surface area analysis, diffuse reflectance spectroscopy (DRS), and temperature-desorption spectroscopy (TDS).
Heating or UV irradiation of the sample in ultra-high vacuum (UHV) conditions induces partial reduction of the surface to form ZnO
1−x, resulting in a patchy heterogeneous surface. This process generates surface defect centers, evidenced by peaks at binding energies E
Ci = 3.2, 2.8, and 2.3 eV in the UV photoelectron spectra (PES) and absorption bands at 3.1, 2.9, and 2.4 eV in the optical spectra. The peaks at 3.2 and 2.3 eV, along with the bands at 3.1 and 2.4 eV, are attributed to surface F and F
+ centers. Their surface concentration is approximately (1–3) × 10
−4 monolayers. The peak at 2.8 eV and the band at 2.9 eV are linked to interstitial Zn
+ cations.
For the first time, it was demonstrated that the photocatalytic reduction of NO by CO to N
2 can occur on self-sensitized ZnO
1−x catalysts under visible light irradiation (λ > 400 nm) at room temperature, achieving a selectivity of up to 95% [
32]. The reaction proceeds via two stages, with N
2O as an intermediate product (). The produced CO
2 remains adsorbed on the surface but can be completely desorbed after completion of the photoreaction by heating ZnO
1−x up to 820 K.
The spectral dependencies observed during both stages align with the optical absorption spectra of intrinsic color centers in ZnO
1−x [
33], which include oxygen vacancies trapping one or two electrons (F
+ and F centers), zinc interstitials (Zn
+), and zinc vacancies trapping holes (V
−) centers). The high quantum yields observed in the visible region are attributed to the long lifetimes (up to 10
3 s) of these photoexcited defect centers, facilitating efficient photocatalytic activity under visible light irradiation.
. Typical kinetics of reaction 1 on ZnO<sub>1−x</sub> under irradiation by visible light (λ > 390 nm).
The kinetic profiles of CO and NO are characteristic of the initial reactant products, whereas those of N
2 correspond to the final products [
32]. The kinetic curve for N
2O emission reflects its role as an intermediate in the reaction pathway. Notably, CO
2, the second final product, was not detected in the gas phase. The nitrogen mass balance indicates that nitrogen-containing species do not remain adsorbed on the surface at the end of the reaction.
The overall reaction proceeds in two distinct stages:
First stage: Characterized by the photo-assisted reduction of NO to N
2O and simultaneous formation of adsorbed CO
2 (CO
2(ads)): $$\mathrm{CO+2NO\overset{hv}{{{\to}}}N_2O\uparrow+CO_{2ads}}$$.
Second stage: Following the completion of NO reduction, N
2O is further reduced to N
2 $$\mathrm{CO+N_2O\overset{hv}{{{\to}}}N_2\uparrow+CO_{2ads}}$$. The CO
2 formed remains adsorbed on the catalyst surface and can be thermally desorbed in a stoichiometric ratio.
The kinetics of this multi-step, two-stage process have been thoroughly analyzed in [
32]. The features observed in this reaction are similar to those reported for photocatalytic processes on TiO
2 Degussa P-25 [
34], indicating comparable mechanisms and efficiencies.
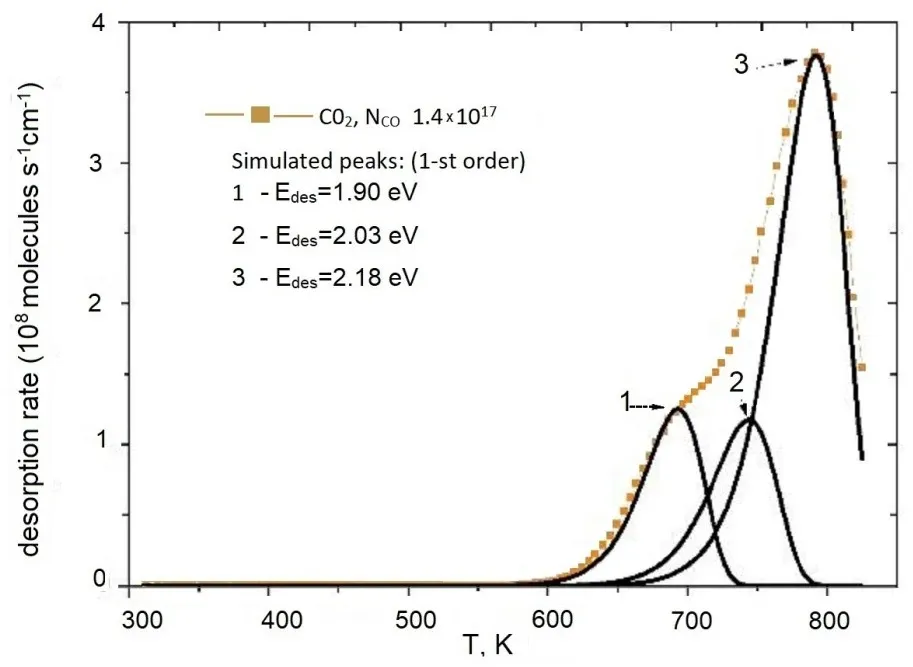
The mass analysis of the TDS of the adsorbed final reaction products () confirmed that the only desorption product is CO
2, which is released upon heating up to 823 K [
32]. The TD spectra feature a prominent maximum in the 750–800 K range, accompanied by low-temperature shoulders appearing at T > 500 K and T > 600 K.
. Temperature-desorption spectrum of the reaction products obtained under visible light irradiation (λ > 390 nm) during reaction 1.
Analysis of spectra where the desorption energy E
des(θ(t)) varies over time was discussed in [
35]. For the modeled first-order TD spectra shown in , the presence of multiple peaks in the desorbed CO
2 spectrum indicates energy inhomogeneity on the surface with respect to adsorption sites.
The binding energies for different forms of CO
2 adsorption, obtained through modeling, are presented in the inset of . Based on the TD spectra and literature data from FTIR studies, structures of intermediate adsorption complexes are proposed to explain these features.
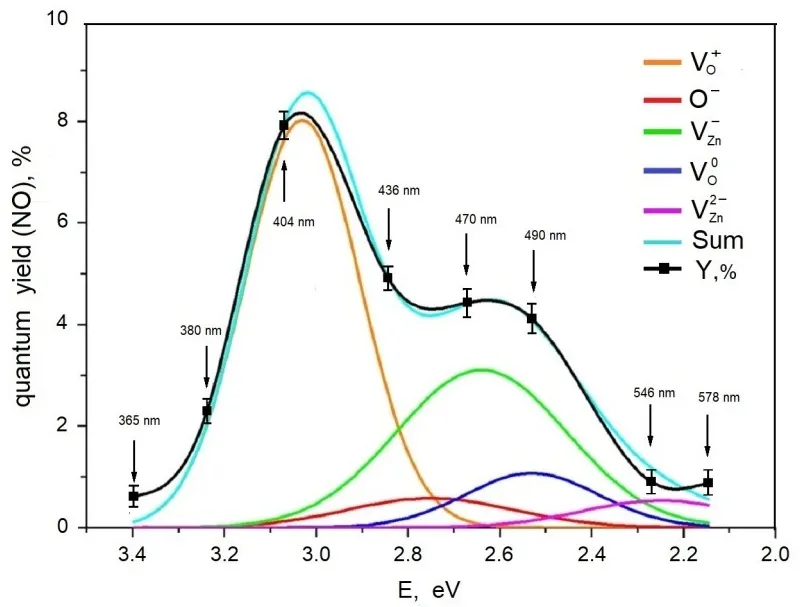
displays the spectral dependence of the quantum yield for NO photoadsorption (PA) on ZnO
1−x. The data reveal that the quantum yield reaches its maxima at photon energies hν = 3.07 eV (λ = 404 nm) and hν = 2.6 eV (λ = 480 nm). Previous studies based on diffuse reflection spectra (DR) identified an absorption band at approximately 3.1 eV, associated with oxygen vacancies capturing a single electron Vo
+ (F
+ center), and a band at around 2.4 eV related to F centers. In reference [
28], the absorption spectrum of ZnO
1−x in the range of 2.2–3.4 eV was decomposed into individual defect-related bands. The first peak coincides with F
+ center absorption, while peaks at 2.5–2.6 eV are attributed respectively to zinc vacancies trapping a hole (V
− center) and to F centers. These defect states predominantly contribute to the observed NO PA effect. Considering the spectral resolution of NO PA excitation, the close overlap between the PA excitation spectrum and the absorption spectra of ZnO
1−x is deemed satisfactory, indicating that these defect centers are primarily responsible for initiating photoadsorption.
. Spectral dependence of the quantum yield of NO PA on ZnO<sub>1−x</sub> (<em>T</em> = 300 K, <em>P</em>0(NO) = 0.013 Torr).
Prior research [
31,
33] has established that these defect centers are highly active in photoadsorption and photocatalytic processes on wide-bandgap oxides. As shown in , minor contributions to the overall effect also originate from interstitial oxygen ions (Oi
−) and zinc vacancies trapping two holes, VZn
2− (V
0 centers). The combined spectral contributions of these defect states allow for an approximation of the NO PA spectrum with about 97% accuracy.
During the first stage of reaction 1, ending when NO photoadsorption is complete, no N
2 molecules are emitted into the gas phase. Instead, various carbon-containing species, such as Zn
+-CO, Zn
2+-CO, CO
2−, CO
3−, as well as nitrogen-containing species like Zn
2+-NO, NO
−, NO
+ form on the surface. During this stage, N
2O is released into the gas phase.
The second stage involves the reduction of N
2O to N
2 and the discharge of CO
2−.
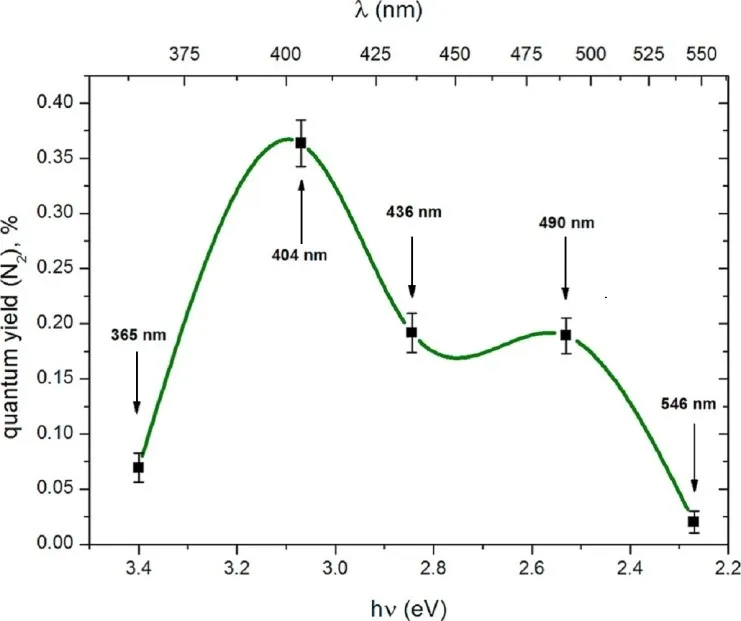
illustrates the spectral dependence of the quantum yield of N
2 formation in the mixture of NO + CO on ZnO
1−x. The maxima observed at 404 nm and 490 nm mirror those seen in the quantum yield of NO photoadsorption (PA) on ZnO
1−x (). However, the quantum yield for N
2 production is more than twenty times lower than that for NO PA, indicating a significantly less efficient process.
. Spectral dependence of the quantum yield of N<sub>2</sub> in the photoinduced reaction NO + CO on ZnO<sub>1−x</sub>.
As shown in the reaction kinetics (), molecular nitrogen is generated via the reduction of an intermediate N
2O species. Notably, N
2 emission begins only after the completion of NO photoadsorption, suggesting that electron capture by NO molecules from electron-donor centers such as F
+ center, VZn − (Zn
+), and F center is more effective than dissociative capture by N
2O molecules. The comparable rates of N
2O adsorption and N
2 release imply that the surface reaction step is not rate-limiting.
Interestingly, the quantum yield of N
2 release in the visible region (up to 530 nm) exceeds that in the UV region despite a lower surface concentration of active defect sites. This phenomenon can be explained by two factors.
- 1.
-
High transparency in the visible light region. The intrinsic surface defect density absorbing in this region (~1011 cm−2) is relatively low, which allows deeper penetration of visible light into the crystallites. Consequently, a larger illuminated surface area is achieved compared to UV illumination.
- 2.
-
Longer defect state lifetimes. The lifetime of photoactivated defect states can reach approximately 103 s, vastly exceeding the estimated lifetime (~10−9 s) of photogenerated electron-hole pairs before recombination. This extended lifetime enhances the probability of defect-mediated processes leading to N2 formation under visible light.
Overall, while the kinetics and mechanisms resemble those previously observed for $$\mathrm{CO}+\mathrm{NO}\overset{\mathrm{hv}}{{\to}}1/2\mathrm{N}_2\uparrow+\mathrm{CO}_{2_{\mathrm{ads}}}$$ on TiO
2−x (Degussa) [
34], both the quantum yield and action spectrum obtained here surpass those for TiO
2−x, indicating higher efficiency of ZnO
1−x under similar conditions.
4.2. Photocatalytic Reduction of NO by CO on TiO2−x/TiO2
4.2.1. Formation of Surface Structure TiO
2−x/TiO
2
Titanium dioxide TiO
2 is widely used for photoelectric and photocatalytic conversion of solar energy in the UV spectral region. In order to sensitize TiO
2 in the visible region, TiO
2 is usually doped with transition metals, nitrogen, sulfur, and other elements [
36]. However, the possibility of self-sensitization of TiO
2 has been established by interruption of its stoichiometry [
35]. Photodesorption of the structural oxygen reduces the surface of the photocatalyst Degussa P-25 TiO
2 to TiO
2−x/TiO
2 and produces on the surface the defects Ti
3+ ions and F− and F
+-type color centers absorbing in the visible region. The vacancies in the cation sublattice localise a hole O
− giving V-type centers. Since the oscillator strength of V-type centers is less than that of F-type ones by a factor 10–100 it is difficult to detect them in optical spectra. Furthermore, photoreduction produces a 2D structure TiO
2−x on the surface only but does not change the bulk stoichiometry. This creates the possibility of sensitizing the photocatalyst to the visible region of the spectrum.
Many years ago, Formenti et al. [
37] have shown by means of electron spin resonance (ESR) that O
2− is formed on the irradiated undoped TiO
2−x/TiO
2 surface in a broad range of wavelengths up to 580 nm. Photo-desorption of the structural oxygen sensitize Degussa P-25 TiO
2−x/TiO
2 to the visible region of the spectrum. In particular, the photoactivated O
2 adsorption/desorption, and the oxygen isotope exchange (POIE) were discovered in the O
2 − (TiO
2−x/TiO
2) system under vis irradiation. It was shown that the correlation of POIE with photocatalytic oxidation of isobutane is manifested in a number of oxides: ZnO, TiO
2, ZrO
2, SnO
2 [
38,
39,
40]. The authors [
40] conclude that POIE research could be fruitful for TiO
2-based visible photocatalysts.
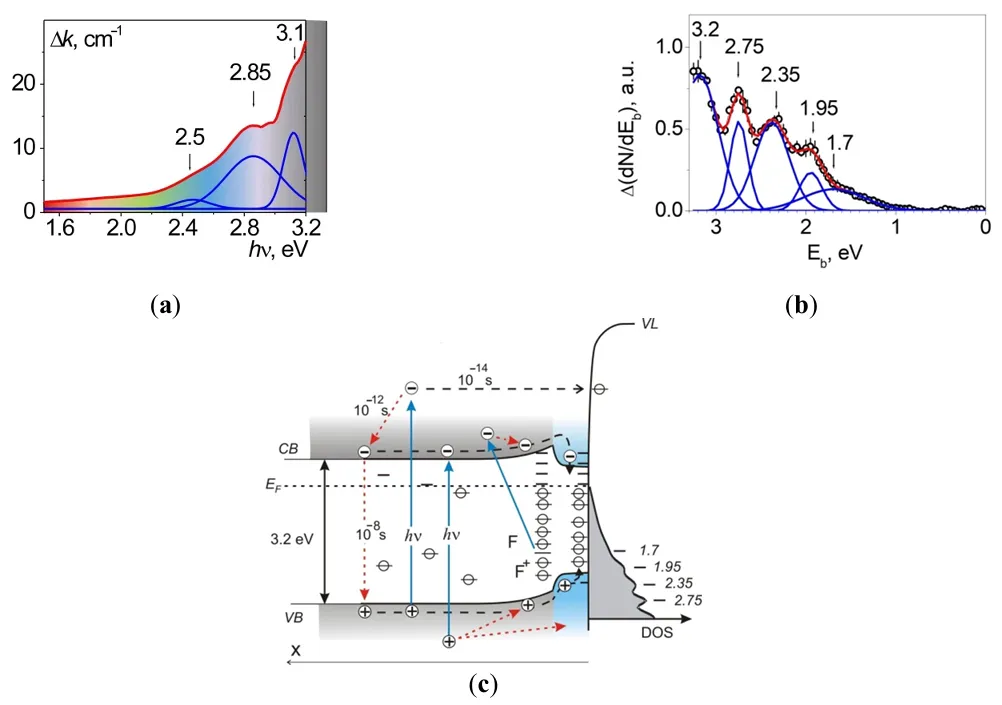
It was found using optical diffuse-reflectance spectroscopy (DRS) and UV (8.43 eV) photoelectron spectroscopy (UPS) that the reduction of TiO
2 induces light absorption in the region 380 < λ < 2500 nm, (0.5 < hν < 3.2 eV); see
a and ref. [
41]. The absorption was ascribed partly to free electrons (a continuum at hν < 1.50 eV), to local centers—Ti
3+ ions, and to F- and F
+-type color centers. In TiO
2−x/TiO
2-based photocatalysts, the surface defects that act as trap sites for photoexcited charge carriers are quenched by the adsorption of gas molecules. The adsorbing oxygen heals the vacancies, forming the O
2− species near the filled vacancies [
42].
. Optical and energetic parameters of the formed 2D-structure of TiO<sub>2−x</sub>/TiO<sub>2</sub>: (<strong>a</strong>) the induced difference optical absorption spectrum relative to TiO<sub>2</sub>; (<strong>b</strong>) the induced spectrum of surface electronic states according to UV (8.43 eV) PES data. The Fermi level is taken as the zero level. (<strong>c</strong>) the electronic Structure of TiO<sub>2−x</sub>/TiO<sub>2</sub>.
The reduction of the surface layer induces absorption across nearly the entire visible spectrum. Filled electronic states appear in the photoelectron spectrum, spanning from the top of the valence band to the Fermi level, see
b.
The formation of the 2D core—shell structures such as TiO
2−x/TiO
2 on some parts of the surface region [
42] and the bandgap decrease in these parts (
c are supposed to be based on the kinetic data (the “fast” excitations in bulk under UV irradiation and the “slow” one for the visible region). Coexistence of two independent excited electronic subsystems, such as the “fast” one for the excitation in the UV region and the “slow” one (up to 10
3 sec.) for the visible region, was revealed (see
). The lifetime of the surface excitations is many orders over the lifetime of the free carriers in the bands and compensates for the difference in the absorption coefficients in the UV and visible regions. The quantum yield of the hole centers O
s− generation rates were found to have a peak around 420 nm as well. These hole centers are highly chemically active: the quantum yield of POIEq in the sub-bandgap absorption region is ~30 times higher than in the fundamental absorption region of TiO
2.
. Efficiency (E) of oxygen isotope exchange (POIE) on oxidized TiO<sub>2−x</sub>/TiO<sub>2</sub> upon UV and various VIS irradiations. The inset displays that VIS POIE and UV POIE are additive.
4.2.2. Mechanism of Photocatalytic Reduction of NO by CO on TiO
2−x/TiO
2
The proposed mechanism must adequately explain the following data: NO photo-adsorption on TiO
2−x/TiO
2, formation of reaction products (N
2O, N
2, and adsorbed CO
2) from photo-adsorbed NO in CO under irradiation, the shape of the kinetic curves.
Photo-adsorption of NO. Visible light irradiation of TiO
2−x/TiO
2 in pure NO produces strongly adsorbed species that cannot be evacuated at room temperature [
43]. This suggests two parallel processes: one of them consumes electron donor species, and another one proceeds without the participation of these species. NO photoadsorption, with consumption of donor species, involves the following reaction sequence:
where e
− stands for F
+ and F centers,
i.e., oxygen anion vacancies filled with one or two e
-, respectively.
NO adsorption resulting in nitrosyl complexes NO(a) can occur on Ti
4+ cus ions and/or F+ and F centers. The formation of nitrosyl complexes upon NO admission on TiO
2 at room and lower (110 K) temperatures was detected by IR and reported in several studies [
44]. NO photoadsorption, accompanied by the formation of electron centers, occurs as follows:
where O
2− is an oxide ion of TiO
2, and NO
2− denotes surface linear (I) or bidentate (II) nitrites. The formation of various types of nitrites and nitrates (NO
3−) on TiO
2 in the presence of NO was detected by IR and reported in several papers [
44,
45]. An alternative mechanism for NO photoadsorption without consumption of electron-donor centers can be described by the following sequence of reactions:
Thus, NO photoadsorption is a disproportionation reaction of NO: NO(a) is reduced to NO
−(a) by donor centers via the reaction 4, whereas NO(a) is oxidized into NO
2− (a) by O
2− ions via the reaction 6.
Formation of N
2O and N
2 upon Photoadsorption of NO
. It appears that N
2O is produced via
with the O
− species rapidly reacting with NO molecules. The overall reaction of N
2O production (reactions 2, 5) can be written as
Most likely, N
2 is formed by N
2O reduction by donor centers,
i.e., N
2O is an intermediate in the reduction of NO
The overall reaction can be written as:
The observed yields of N
2 and N
2O are very small, and in the absence of CO, are only 2.5% and 0.8%, respectively, from the amount of NO photoadsorbed.
Reaction Scheme upon Visible Light Irradiation of TiO
2−x/TiO
2 in CO-NO Mixtures. As shown above, the main photoadsorption product is NO
2−(a) (reaction 6), and one can assume that N
2 and N
2O are formed under irradiation in CO via NO
2− (a) reduction by the following sequence of reactions:
The above sequence of reactions can also be presented by the reaction cycle shown in
. The overall process according to this reaction sequence can be written as
The scheme (
) suggests the formation of adsorbed CO
2−(a) or carbonate species. It has been found [
46] that carbonate species (bridged, bidentate, and monodentate) on TiO
2 surface are rather thermally stable: according to IR data, these species are destroyed only partially upon heating to 340 K. This may explain why gaseous CO
2 is not detected upon irradiation at room temperature and only appears upon irradiation at 340 K.
The quantum yield of POIEq in the sub-bandgap absorption region is ~30 times higher than in the fundamental absorption region of TiO
2.
. Reaction Scheme upon Visible Light Irradiation of TiO<sub>2−x</sub>/TiO<sub>2</sub> in CO-NO Mixtures.
The results of complex studies of optical, electrophysical, and photocatalytic parameters in wide-bandgap oxide photocatalysts, such as dielectrics and semiconductors, obtained by a variety of complementary experimental methods, can be summarized below. A partial reduction is a universal method of self-sensitization of wide bandgap oxides. The induced oxygen vacancies form colored long-lived F- and V-type point defects that are photocatalytical active centers.
2D heterostructures ZnO/ZnO1−x and TiO2/TiO2−x creation on oxide surfaces by controlled photo-desorption of surface oxygen resulting in the bandgap reduction at the surface down to 2.7 Ev, concentrates the active sites on the surface in a monoatomic thickness layer. Since the electron exchange between the surface and the volume is disrupted, the lifetime of the active centers at the surface increases, reaching 103 s. As a result, the measured photocatalytic activity of one surface center is several times higher compared to the activity of similar volume centers.
To enhance the exciton efficiency, a layered nanostructure ZnO/ZnO1−x/O− was designed. An outer layer is superimposed on the ZnO/ZnO1−x structure. This is a “dead zone” in which the exciton decays, forming F- and V-type centers on the surface. The structure efficiency is demonstrated by the example of the POIE reaction.
An experimental testing of self-sensitizated photocatalysts revealed that the quantum yield of the redox reaction $$\mathrm{CO}+\mathrm{NO}\overset{\mathrm{hv}}{\operatorname*{\to}}1/2\mathrm{N}_2\uparrow+\mathrm{CO}_{2_{\mathrm{ads}}}$$ on self-sensitized photocatalysts in the visible region is several times higher than that of the initial oxides in the UV region and remains stable during exploitation.
The author is grateful to the co-authors of the cited works.
Not applicable.
Not applicable.
Data is available on request.
This research received no external funding.
The author declares that he has no known competing financial interests or personal relationships that could have appeared to influence the work reported in this paper.